|
 |
|
| |||||||||||||||||||||||||||||||||||||||||||||||||||||||||||||||||||||||||||||||||||||||||||||||||||||||||||||||||||||||||||||||||||||||||||||||||||||||||||||||||||||||||||||||||||||||||||||||||||||||||||||||||||||||||||||||||||||||||||||||||||||||||||||||||||||||||||||||||||||||||||||||||||||||||||||||||||||||||||||||||||||||||||||||||||||||||||||||||||||||||||||||||||||||||||||||||||||||||||||||||||||||||||||||||||||||||||||||||||||||||||||||||||||||||||||||||||||||||||||||||||||||||||||||||||||||||||||||||||||||||||||||||||||||||||||||||||||||||||||||||||||||||||||||||||||||||||||||||||||||||||||||||||||||||||||||||||||||||||||||||||||||||||||||||||||||||||||||||||||||||||||||||||||||||||||||||||||||||||||||||||||||||||||||||||||||||||||||||||||||||||||||||||||||||||||||||||||||||||||||||||||||||||||||||||||||||||||||||||||||||||||||||||||||||||||||||||||||||||||||||||||||||||||||||||||||||||||||||||||||||||||||||||||||||||||||||||||||||||||||||||||||||||||||||||||||||||||||||||||||
|
March 09, 2009
Catching the Floater
Permalink Art Martone donated $50 or more to the Baseball Musings Pledge Drive and dedicates this post to the Projo Sox Blog. George Kottaras gets a chance to catch Tim Wakefield this week: After all, Kottaras, 25, might have a shot to become the knuckleballer's personal batterymate. Bard did a poor job with Wakefield in his last stint with Boston, so the Red Sox need a backup plan. Posted by StatsGuru at 06:47 PM
| Comments (2)
| TrackBack (0)
March 06, 2009
Great Defense
Permalink Many years ago in one of his Baseball Abstracts, Bill James explored the possibility that Ozzie Smith saved the Cardinals 100 runs with his glove (according to Whitey Herzog). James pegged it at closer to 25. Tom Tango looks at the savings a great fielder provides and finds it's about 25 runs. Nice to see different studies years apart come to the same conclusion. Posted by StatsGuru at 11:40 AM
| Comments (6)
| TrackBack (0)
March 03, 2009
Fielding Runs
Permalink J.C. Bradbury excerpts the new book from John Dewan, The Fielding Bible--Volume II Hat tip, The Book Blog. Please donate to the Baseball Musings Pledge Drive. Posted by StatsGuru at 10:47 AM
| Comments (0)
| TrackBack (0)
February 26, 2009
Making the Catch
Permalink Josh Bard did not let a Tim Wakefield pitch get by Wednesday night. Posted by StatsGuru at 08:49 AM
| Comments (2)
| TrackBack (0)
February 24, 2009
Jeter's Errors Don't Hurt
Permalink Michael Walsh says we're all wrong about Derek Jeter's defense, because his actual errors haven't cost the Yankees that many games! Regardless of the conclusions of any individual study, scientific or otherwise, there is no question that Derek Jeter is nothing less than a solid defender. For anyone to even infer that he may be the worst fielder in all of baseball is simply ridiculous. Truth be told, the current version of Derek Jeter is flashing better leather than the 23-year-old kid who made those costly errors in 1997. It's not about the errors Jeter makes, it's about all the balls that he never gets a glove on that other shortstops turn into outs. I'm surprised an article like this made it to Dugout Central. Posted by StatsGuru at 10:26 AM
| Comments (4)
| TrackBack (0)
January 29, 2009
Improving Pitching?
Permalink Lyflines examines the idea that Jason Varitek improves the Boston pitching staff. Posted by StatsGuru at 09:17 PM
| Comments (1)
| TrackBack (0)
January 27, 2009
Throwing Gene
Permalink Brian Cartwright developed a probabilistic model of catcher caught stealings. The three Molina brothers all come out near the top of the list in 2008. Posted by StatsGuru at 08:38 AM
| Comments (0)
| TrackBack (0)
January 26, 2009
Improving Defense
Permalink Via The Detroit Tigers Weblog, Lynn Henning does a good job of explaining the defensive statistics the Tigers are using to evaluate players and improve the left side fielders. Dombrowski talked about defense as coverage during Saturday's TigerFest at Comerica Park. It's nice to see these statistics working their way into newspaper articles. However, I'd like to see something on the offensive tradeoffs here. Posted by StatsGuru at 08:36 AM
| Comments (3)
| TrackBack (0)
January 22, 2009
Armed and Dangerous
Permalink The Hardball Times publishes the best outfield arms of 2008. Posted by StatsGuru at 04:51 PM
| Comments (0)
| TrackBack (0)
January 11, 2009
Bartlett's Defense
Permalink DRays Bay examines the reasons for Jason Barlett's defensive decline in 2008. Posted by StatsGuru at 08:35 PM
| Comments (0)
| TrackBack (0)
January 05, 2009
Enough Range?
Permalink Nico at Athletics Nation wonders if Oakland signs Giambi if they'll use a shift of infielders to make up for Jason's lack of range. Chase Utley appeared to shade toward first base to help out Ryan Howard this year, so it just might work. Posted by StatsGuru at 09:47 PM
| Comments (3)
| TrackBack (0)
December 09, 2008
Comparing Fielding Systems
Permalink Tom Tango compares both UZR models with PMR at The Book Blog. Posted by StatsGuru at 06:16 PM
| Comments (0)
| TrackBack (0)
December 08, 2008
UZR/PMR Comparison
Permalink Dan Turkenkopf runs correlations of UZR and PMR and I find them surprisingly low, given the two systems use the same data. Both PMR and UZR were calculated using the Baseball Info Solutions (BIS) data set this season. I wonder if David or MGL might be able to give some ideas as to where the differences might come from. I don't know enough about the UZR calculations to speculate. I base my models mostly on visiting players in parks, however. UZR might use all the data. I also don't know if UZR, like +/-, doesn't penalize players for outs made by others. In PMR. If the right fielder catches a ball that the centerfielder might be able to catch, the centerfielder is penalized. In +/-, the centerfielder is not. Given the low correlation with centerfielders, I suspect that's the case. Posted by StatsGuru at 08:36 AM
| Comments (0)
| TrackBack (0)
December 07, 2008
More Defensive Stats
Permalink Ultimate Zone Rating (UZR) is now available on FanGraphs.com. The version on FanGraphs uses BIS data, not STATS, Inc. data, so it will be interesting to see how it compares to the Probabilistic Model of Range, which also uses BIS. Taking a quick look at shortstop, Jeter finishes in the middle of the pack, just like in PMR. Posted by StatsGuru at 12:04 PM
| Comments (0)
| TrackBack (0)
November 04, 2008
Jeter Worst
Permalink Jeter is really getting hammered in the media for his rank in the Fielding Bible Awards. How many years does he need to rank at the bottom of shortstops before the Yankees move him? Centerfield, right now, is still open. Put Jeter there where his speed and fly ball instincts work. Especially if the Yankees end up with Derek Lowe, they are going to need a shortstop who can gobble up the ball. For those of you who are waiting, Probabilistic Model of Range rankings are coming soon. Posted by StatsGuru at 10:28 AM
| Comments (5)
| TrackBack (0)
October 13, 2008
No Bad Throws
Permalink Balls, Sticks and Stuff proposes a rule for Ryan Howard and throws. Posted by StatsGuru at 11:01 PM
| Comments (1)
| TrackBack (0)
October 12, 2008
Shallow Defense
Permalink Spitting Seeds is concerned B.J. Upton plays too shallow in centerfield. I think most outfielder play too deep, so I can't really complain about this too much. Posted by StatsGuru at 01:46 AM
| Comments (0)
| TrackBack (0)
October 01, 2008
Cameron's Explanation
Permalink Mike Cameron explains here why he misjudged the ball that led to the Phillies runs. "I cut across like it was going to go down but it kept rising," said Cameron. "My first instinct was that it was not going to travel, because of the way the wind was blowing. It just kind of took off." Mike chases fly balls differently than most outfielders. Instead of tracking the ball all the way, Mike developed an excellent pattern recognizer that allows him to judge where the ball will go off the bat and run there without following the ball too closely. Today, that recognizer made a mistake. Despite that, he almost made a great catch. Posted by StatsGuru at 10:37 PM
| Comments (5)
| TrackBack (0)
September 14, 2008
Wide Wingspan
Permalink It's a good thing Corey Hart stands 6' 6". On a Werth fly to right, Corey fought the sun and picked up the ball at the last second. He stretched out his arm and just reached the ball, tumbling up holding on. The catch came with two on and two out and preserved the Brewers 3-1 lead at the end of five. Posted by StatsGuru at 02:53 PM
| Comments (0)
| TrackBack (0)
September 06, 2008
Eye Line
Permalink A new study reveals why line drives hit right at an outfielder are so difficult to catch: Then they presented their subjects with two targets moving at the same speed -- one laterally and one in depth -- and asked them to decide which was faster. On average, they said the lateral motion was 1.3 to 2.7 times faster than an object at the identical speed but moving straight at them. Very cool. So next time an outfielder misses a hard shot right at him, cut the player some slack. Posted by StatsGuru at 03:57 PM
| Comments (4)
| TrackBack (0)
August 24, 2008
Wisdom of the Crowds
Permalink Once again, Tom Tango is looking for your help in rating fielders. Here's your chance to add your expertise to the fans scouting report. Posted by StatsGuru at 11:16 PM
| Comments (0)
| TrackBack (0)
Nice Catches in Philly
Permalink The Phillies make two nice catches in the top of the sixth against the Dodgers. Loney hit a long drive to deep centerfield, and Shane Victorino ran it down, making it look easy. With Garciaparra at first with two out, Martin hit a pop foul down the rightfield line. Ryan Howard raced down the line dived near the stands and made the catch. The Phillies are known for their offense, but in a 1-1 game they are flashing a little leather. Howard, who made the great play to end the top of the inning, leads off the bottom half. Posted by StatsGuru at 10:01 PM
| Comments (0)
| TrackBack (0)
August 19, 2008
Overbay to Save the Day
Permalink Lyle Overbay just saved the game for the Blue Jays. With the score 2-1 in favor of Toronto in the top of the ninth, Alex Rodriguez hits one off the end of the bat that lands over Overbay's head in right. A-Rod wasn't running that hard, thinking it would either be caught or fall for a single. The ball however, rolled away from Lyle, and Alex turned it on for second. Overbay ran the ball down, slid picking it up and made a perfect throw to second to nab Alex. B.J. Ryan retires the last two batters and Toronto wins 2-1. They are now just one game behind the Yankees for third place in the AL East. Posted by StatsGuru at 09:34 PM
| Comments (0)
| TrackBack (0)
August 03, 2008
Lead Gloves
Permalink Rare poor defense by the Angels allows the Yankees to tie the game in the eighth. Ivan Rodriguez singles (he homered earlier). Melky Cabrera is sent to sacrifice, but Shields falls behind 3-0, and Melky takes two to run the count 3-2. At that point, Justin Christian pinch runs, and starts on the next pitch. Aybar moves to cover second, and Melky grounds one right to him. He's not ready for it, and the ball bounds off his chest for an error. Then, the two attempt a double steal. Figgins is in as Damon squared to bunt, and Mathis throws to a back-peddling Figgins, but the ball goes into leftfield. Christian scores, and the Yankees now have 2nd and 3rd with one out. Usually, it's the Angels speed and the Yankees poor defense that makes the difference between these two teams. Update: Abreu walks to load the bases. A-Rod hits a grounder to third, but instead of a double play, Figgins bobbles the ball and doesn't get an out. The Yankees take a 10-9 lead. Update: Cano knocks in two with a single and the Yankees take a 12-9 lead. Posted by StatsGuru at 04:02 PM
| Comments (4)
| TrackBack (0)
July 14, 2008
Slating Defense
Permalink Nate DiMeo pens an article for Slate titled, "Derek Jeter vs. Objective Reality." He's asking why there is a disconnect between what fans think of Jeter's defense and what statistical research shows. There's another question he asks as well: If the sabermetric case against Jeter's glove has long been closed, why do the sabermetricians keep opening it? In an e-mail, Tom Tango joked that Jeter comes up again and again "because he gets far more girls than his fielding talents should allow." And there's probably something to that: The stat guys want to kick a little sand back at the press-box bullies--all of whom seem to have Word macros for phrases like "nerd writing in his mother's basement"--who lazily swallow the myth of Jeter's fielding prowess. I would note, too, that the case for OBA was made in quite the same way. Sabermetricans talked and talked about OBA for years before people started to pay attention. It was probably Sandy Alderson who helped move it into the main stream. I remember an ESPN broadcast where Gary Thorne suddenly started praising OBA because Alderson talked about it in an interview. At some point, a GM will say something like, "We signed him as a free agent, because despite all the errors our probabilistic models show he turns lots of tough hits into outs." Then these models will start gaining acceptance. Thanks to Nate for a link to the Probabilistic Mode of Range. Posted by StatsGuru at 08:56 AM
| Comments (7)
| TrackBack (0)
June 29, 2008
The Grab
Permalink I just saw the highlight of Matt Treanor's double play last night. The ball was bunted, and Matt grabbed it out of the air and threw to second for the double play. Seems like a good time to recall this Treanor story. The Diamondbacks get a two-run homer from Stephen Drew to take a 2-0 lead over the Marlins in the third. Posted by StatsGuru at 01:40 PM
| Comments (0)
| TrackBack (0)
June 26, 2008
All You Need is Glove
Permalink Joe Christensen describes the fielding drill that helped Alexi Casilla make a spectacular play Wednesday night. It's one of the little things Ron Gardenhire works on to make the team better. Posted by StatsGuru at 11:00 AM
| Comments (0)
| TrackBack (0)
June 24, 2008
Measuring Defense
Permalink Pizza Cutter is doing some very good work on defense at MVN. I like the way he's trying to separate the ability to get to a ball from the ability to field the ball. Posted by StatsGuru at 12:23 PM
| Comments (0)
| TrackBack (0)
June 01, 2008
Mixing and Matching
Permalink Jim Leyland adds another wrinkle to the Tigers defense. He's going to use Carlos Guillen in leftfield sometimes to get Inge games at third base: Manager Jim Leyland said Saturday that Guillen probably will start in left field today against the Mariners. To his credit, Guillen is game. He was signed as an outfielder but moved to the infield when he started in pro ball. "I'm not afraid to play left," Guillen said. "You have to have confidence to play this game. You play this game with passion." Posted by StatsGuru at 10:53 AM
| Comments (0)
| TrackBack (0)
May 29, 2008
No Man is an Islet
Permalink Ryan Langerhans is back with the Nationals and just made a possible game saving catch in San Diego. With the score tied at two in the bottom of the eighth, Kevin Kouzmanoff launches one to the stand in leftfield. Ryan leaped, got his glove over the railing, and pulled the ball back in to preserve the tie. He's also singled and driven in a run. Update: The catch is for naught as Jody Gerut hits a three-run homer down the rightfield line for a 5-2 lead. Posted by StatsGuru at 05:53 PM
| Comments (4)
| TrackBack (0)
May 27, 2008
A Little Defense
Permalink Nick Cafardo makes Dustin Pedroia the center of his piece on the Red Sox 5-3 win over the Mariners Monday night. He notes a defensive play in the third as a key moment in the game: Take the play he made in the third inning of last night's 5-3 win over the Mariners: runners at first and second, two outs, when Jose Lopez hit a ball that for all intents and purposes should have gone through into right field for a run-producing hit. Yet Pedroia, who was positioned more toward second base, got a good jump on the ball and made a diving play to the first base side to retire Lopez and keep Bartolo Colon out of peril. (Actually, there were runners at first and third.) I saw the play last night and watched it again this morning. It was a nice play by Dustin, the kind that separates a good fielder from a bad one. It's an easy out if the fielder is positioned differently. Pedroia showed on that play what we normally consider range, the ability to cover a lot of ground to get to a ball. When I run the Probabalistic Model of Range, I define range as the ability to turn a ball into an out. Positioning plays a large role in that. One would expect the players that can make up for being out of position on a ball with their ability to cover ground will tend to score higher in the rankings. Maybe when we get Joe Maddon's GPS system we'll know for sure. Posted by StatsGuru at 07:56 AM
| Comments (2)
| TrackBack (0)
May 26, 2008
Defensive Manager
Permalink I like the way Joe Maddon thinks about defense. Posted by StatsGuru at 10:14 PM
| Comments (0)
| TrackBack (0)
May 19, 2008
No Hit Tek
Permalink NESN is reporting that Varitek is the first catcher to receive four no hitters. They left Torborg off their graphic as catchers who caught three. Can anyone think of anyone else who caught four? Add to that Schilling's near no-hitter last season, and Varitek's had quite the low-hit career. Posted by StatsGuru at 09:56 PM
| Comments (8)
| TrackBack (0)
May 18, 2008
New Position
Permalink Hank Blalock volunteered to move to first base when he comes off the disabled list: "It's his decision," Texas manager Ron Washington said. "He said he had looked at the team and thought he could help the squad more at first. This is Hank just being a very intelligent baseball man," Blalock was hitting better this season before he tore the hamstring. Rangers this season have gotten a .602 OPS out of their first basemen coming into Sunday's games. Posted by StatsGuru at 10:56 PM
| Comments (1)
| TrackBack (0)
May 16, 2008
Reaching Third on a Strikeout
Permalink You don't see this too often. Kuroda strikes out Aybar, but the pitch is not caught cleanly. With a man on second and two out, Aybar starts running to first. The catcher, Bennett, throws the ball over the head of the first baseman down the leftfield line. Kotchman scores from second, and Aybar turns on the afterburner and reaches third base. A strikeout triple! The Angels take a 1-0 lead in the fourth. Posted by StatsGuru at 11:10 PM
| Comments (0)
| TrackBack (0)
May 14, 2008
Swirling Winds
Permalink Richard Durrett made the case this morning in the Dallas Morning News that the Rangers did what they needed to change themselves for the better, including defense: The club that bobbled balls, missed cut-off men, made errant throws and beat itself to start the season has morphed into one that is putting together an impressive highlight reel of defensive plays, adding four more to the collection Tuesday. That's true, but everyonce in a while the wind shifts back to the old ways. A bobbled ground ball and a mis-read line drive lead to two innings in the seventh inning today, giving the Mariners a 3-2 lead. Scott Feldman pitched very well today, but the two unearned runs mean he's now in line for a loss. Update: Hamilton makes up for the misplayed line drive with a sacrifice fly in the bottom of the eighth to tie the game at three. Posted by StatsGuru at 03:42 PM
| Comments (0)
| TrackBack (0)
May 12, 2008
The Dive for the Shutout
Permalink With men on first and third and two out in the top of the ninth, Franklin Gutierrez came up with the second great dive of the game. Mench hit a high liner into right center. It looked like it would drop to plate the first run of the game, but it hung up just long enough for Franklin to get over and make the diving catch. Two batters earlier, with a man on second, Rios hit a hard line drive snared by Victor Martinez at first. Lee completes nine scoreless innings to lower his ERA to 0.67. Now the Indians need to plate a run to get him a win. Marcum is out of the game after eight innings. Ryan tries to preserve the tie. Update: Ryan gets two popups as he retires the side in order. The game will be decided in extra innings. The Indians still have just two hits. Update: Stewart breaks the scoreless tie in the tenth, and Hill follows with a two-run single to give Toronto a 3-0 lead. Posted by StatsGuru at 09:32 PM
| Comments (3)
| TrackBack (0)
Triple Play, 4
Permalink Andrew Marshall writes: Asdrubal Cabrera just turned an unassisted triple play behind Cliff Lee. This offense (Toronto) has become comically bad. The Indians, of course, have the only unassisted triple play in World Series history, way back in 1920. This evening, the runners were going, Overbay hit a line drive that Asdrubal caught on a dive. The runners had already advanced a base, so Cabrera just had to tag the base and the runner from first to complete the TP. The game remains scoreless in the top of the sixth. Posted by StatsGuru at 08:33 PM
| Comments (2)
| TrackBack (0)
May 04, 2008
Tough Roof
Permalink It must be tough to see pop ups in foul area on the third base side in Arizona. Mark Reynolds over-ran a ball near the stands earlier, and just now Schneider called off Wright, then lost the ball. The Mets lead 2-1 in the bottom of the fifth. Posted by StatsGuru at 05:44 PM
| Comments (0)
| TrackBack (0)
April 30, 2008
Catching the Ball
Permalink My latest column at SportingNews.com examines how the Rays defense is contributing to the improvement in their team ERA. Posted by StatsGuru at 04:49 PM
| Comments (0)
| TrackBack (0)
April 22, 2008
Shift Across the Diamond
Permalink Jim Leyland decided to switch Miguel Cabrera and Carlos Guillen defensively. So now Miguel's followed the full Albert Pujols path. Posted by StatsGuru at 11:43 PM
| Comments (5)
| TrackBack (0)
All You Need is Glove
Permalink There was plenty of praise for Chase Utley's glove last night: With the bases loaded and one out and the Phillies trailing 3-0, second baseman Chase Utley launched himself parallel to the infield dirt and somehow managed to snag Clint Barmes' hard-hit chopper that seemed destined for centerfield. After landing flat on his torso, he raised his glove and shoveled the ball to shortstop Eric Bruntlett, who made a quick throw to first base for an inning-ending doubleplay. Power and defense at second base is a rare combination. Morgan and Sandberg are the only two in my lifetime who did both extremely well. Utley was among the best second baseman in range as measured by PMR last season. Posted by StatsGuru at 08:16 AM
| Comments (5)
| TrackBack (0)
April 21, 2008
Ordonez Shift
Permalink The Tigers broadcast pointed out something about the defensive alignment against Magglio Ordonez. The first baseman is playing way off the line, in what would usually be the hole between second and first. According to them, Ordonez hit a good many balls there last season, and few down the first base line. It's a good defensive adjustment so far, as they've kept Magglio's average down to .264. Posted by StatsGuru at 02:26 PM
| Comments (0)
| TrackBack (0)
April 17, 2008
E5
Permalink When I was in college, my roommates and I used to kid that the threshold for an error was set too low. Our opinion was that if the greatest fielder at the position would have made the play, then it should go as an error. With Kyle Lohse at the plate and the bases loaded, he slapped a ball to the left of Counsell at third. Counsell was in, he dove, but the ball went under his glove for a two-run single. Since Graig Nettles would have not only snagged the ball, but turned it into a double play, Counsell should really get an E5.. :-) By the way, I love Brian Barton's socks. He's mixed a 50s uniform with a wild hairdo. The contrast looks great. Posted by StatsGuru at 02:24 PM
| Comments (0)
| TrackBack (0)
April 15, 2008
Shortstop in Center
Permalink Alexei Ramirez starts in centerfield for the White Sox today and makes a spectacular throw to get Emil Brown. Brown hit a ball into the gap in right-center. Ramirez got to the hit in a hurry, grabbed the ball spun and threw a strike to second base without setting himself. Brown was out by a mile. Alexei showed off everything on that play; speed, soft hands, and an accurate and powerful arm. Look for that play on Web Gems tonight. The game is scoreless in the second. Posted by StatsGuru at 02:28 PM
| Comments (0)
| TrackBack (0)
April 14, 2008
Catchers Fielding
Permalink I don't think of Victor Martinez as a defensive catcher, but he just made a great play on Coco Crisp. Crisp laid a bunt down the third base line that died at the grass cut out in front of the plate. Martinez sprang like a cat on the ball threw off balance and got Crisp at first. He showed quickness and a strong, accurate arm on that play. Posted by StatsGuru at 07:10 PM
| Comments (0)
| TrackBack (0)
April 10, 2008
Vacuuming Up Balls
Permalink Soccer Dad notes the Orioles posted a .772 DER in their first seven games. They're like a black hole for balls in play. Posted by StatsGuru at 11:50 AM
| Comments (0)
| TrackBack (0)
April 04, 2008
Rare Bad Play
Permalink Orlando Cabrera made a rare poor play for the White Sox. With a man on first, he ranged to his right for a ground ball off the bat of Polanco. Cabrera got there in time, but the ball skipped under his glove. He appeared to be looking for a higher bounce. The official scorer gave Polanco a hit, and a double play cleared the extra runner. The White Sox and Tigers are tied at five in the top of the fifth. Carlos Quentin hit his first home run for the pale hose. Posted by StatsGuru at 02:33 PM
| Comments (0)
| TrackBack (0)
Menance in the Outfield
Permalink Sox Machine notes the biggest threat to Jerry Owens's health after he returns to the White Sox. Posted by StatsGuru at 08:21 AM
| Comments (0)
| TrackBack (0)
April 03, 2008
Cool Hand Youk
Permalink The Soxaholix makes Kevin Youkilis the center of water cooler talk today for passing Steve Garvey for errorless games at first base. Keep in mind, however, that first basemen don't make a lot of errors in general. As for range, Kevin is a bit above average. Posted by StatsGuru at 12:29 PM
| Comments (1)
| TrackBack (0)
April 01, 2008
Error Free
Permalink Kevin Youkilis can tie a fielding record tonight. Posted by StatsGuru at 11:25 PM
| Comments (2)
| TrackBack (0)
March 25, 2008
Ellsbury Leather
Permalink Emil Brown hits a ball to the warning track in straight away center than Ellsbury catches with a backward leap. He crashes into the wall but holds on to the ball. The NESN announcers are calling it a great catch, but I think he leaped too early. If he stays on his feet and keeps running I think he gets under the ball. Still, and out's and out, and it must be difficult playing under that white ceiling. The A's go 1-2-3 in the eighth. The Sox have three outs to get one run. Lowell, Moss and Varitek are due up. Posted by StatsGuru at 08:48 AM
| Comments (1)
| TrackBack (0)
Giambi, First Baseman
Permalink Giambi receives praise for his play at first this spring: "The thing I've learned is that you have to change your training," Giambi said. "It stunk going through everything, but it all was a blessing in disguise. Even tearing my foot." We'll see long that lasts during the regular season. Having Giambi at first, however, gives the Yankees their best offensive team. Posted by StatsGuru at 07:23 AM
| Comments (1)
| TrackBack (0)
March 19, 2008
Outfield Defense
Permalink The Transaction Guy makes a good case for the Padres 2008 outfield defense hurting the pitching staff this season. Posted by StatsGuru at 09:45 PM
| Comments (0)
| TrackBack (0)
February 24, 2008
The Jeter Debate
Permalink Via WasWatching, Joel Sherman joins the Jeter debate: But what is being missed here is the preponderance of evidence against Jeter's defensive game. This is not just one set of Ivy League academics calling Jeter the majors' worst fielding shortstop. Just about every respected baseball statistician who has publicized results reveals Jeter is, at best, among the poorest defensive shortstops in the game. I'm very glad this debate is now fully out in the open. It's easy to dismiss one study, but when all of them point in the same direction, year after year, people start to notice. It looks like one of those people was indeed Jeter: Perhaps the strongest condemnation came from Jeter, who said, "Last year, I didn't have a good year defensively." Actions speak louder than words. Posted by StatsGuru at 09:15 AM
| Comments (8)
| TrackBack (0)
February 23, 2008
Jeter in the Outfield
Permalink Via WasWatching, Jeter says no to a position shift: Many scouts believe Jeter would be able to make an easy transition to the outfield, where his speed, strong arm and terrific instincts would make him a natural. Asked about the possibility, Jeter waves off the question before it's finished. He doesn't move to his left or right well. Posted by StatsGuru at 09:50 AM
| Comments (4)
| TrackBack (0)
February 21, 2008
Michael on Jeter
Permalink Via MLB FanHouse, Derek Jeter and Gene Michael talk about the shortstop's poor range: "Maybe it was a computer glitch," the three-time Gold Glove winner said of the report. But Jeter just didn't laugh this one off. He defended himself, saying, "Every [shortstop] doesn't stay in the same spot, everyone doesn't have the same pitching. Everyone doesn't have the same hitters running, it's impossible to do that." Of course, we do take most of those factors into account. For every Ichiro running to first, there's a Jason Giambi. Over time, those factors even out. As for the pitching staff, the Yankees have undergone numerous changes over the last few years, and somehow Derek stays at the bottom of the pack. I'd also like to comment on one thing from the FanHouse post (emphasis added): Baseball's different. It's very easy to watch Jeter fly deep in the hole, plant, pivot and gun a runner and come to the conclusion that he's a great fielder. It's a pretty play, full of athleticism and grace and that's more memorable than a grounder that finds a hole or a double play that doesn't get turned. That doesn't make it more important, though. These kinds of analysis help us understand baseball in its fullest context. That context, however, doesn't matter much when Jeter cuts off a poor throw, flips it to the plate and saves a run. 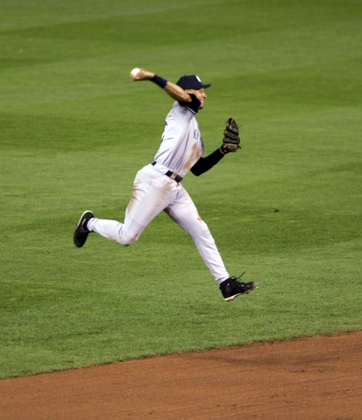
04 September 2006: New York Yankees shortstop Derek Jeter makes a throw to 1st base but is unable to get Kansas City Royals center fielder Joey Gathright out in the 5th inning at Kauffman Stadium in Kansas City, MO. If Jeter actually planted and pivoted in the hole, I think his numbers would be better. What he actually does is stop, jump and throw, using only his arm to get the ball to first. His movement is more like a skater transferring kinetic energy from the horizontal to the vertical with a toe pick. None of that energy is being used to hurl the ball toward first base. I cringe every time he tries to make that play, because no matter how good it looks, it's the wrong way to throw. If he stopped, planted and used his whole body to send the ball across the diamond, he'd make a stronger and more accurate throw. How many times does that toss pull the first baseman off the bag or sail over his head? David Eckstein can make the plant and throw play, why can't the bigger and stronger Jeter? Update: Tango's take. Update: 100% Injury Rate chimes in. He points to some old data that shows Jeter wasn't the best fielding shortstop on his team, with the same pitching staff. The same things shows up in 2007 PMR. As a team, the Yankees shortstops produced 38 fewer outs than expected. Jeter, however, produced forty fewer outs than expected! So the replacements were a bit better. Posted by StatsGuru at 11:37 AM
| Comments (11)
| TrackBack (0)
February 17, 2008
Left Side Defense
Permalink One of the things to come out of the talk yesterday was that Troy Tulowitzki seemed to be covering for Garrett Atkins defensive woes. Tulowitzki produced 50 outs more than expected in 2007, while Atkins missed about 48 outs. You can see from their ground ball PMR graphs, that the difference happens in the hole: 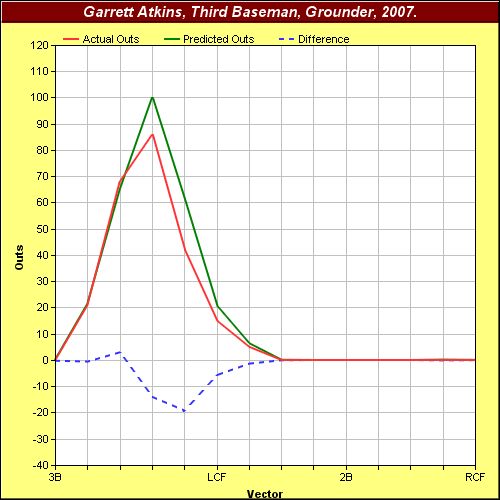
Atkins, 2007 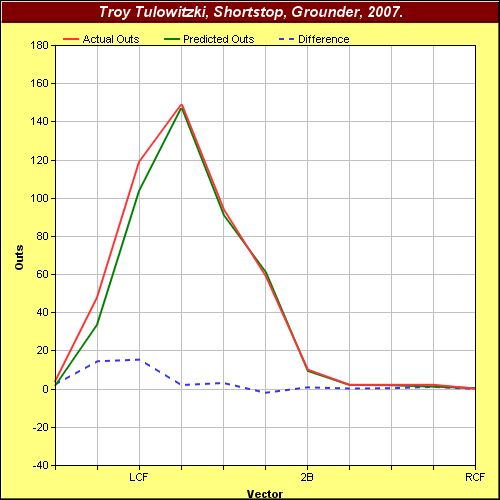
Tulowitzki 2007 Alan Schwarz, during the talk, wondered if this was more a reflection of strategy on the part of the Rockies as opposed a Garrett Atkins fielding deficiency. Apparently not. Last spring, rookie Troy Tulowitzki had to take it. This year, as a rich, budding star, he's dishing it out. Tulowitzki was kidding, but there's a element of truth there. Note that the Rockies didn't lock up Atkins long term. Hat tip, Purple Row. Posted by StatsGuru at 10:51 AM
| Comments (0)
| TrackBack (0)
November 26, 2007
Does a Good Offense Improve a Defense?
Permalink One criticism leveled at the Probabilistic Model of Range this year is that due to building the models based on the visiting team fielders, teams with good offenses get a bonus defensively. The example given is the Yankees, but there are other high offense teams ranked high in terms of PMR. The idea is that since the Yankees hit well, their opponents DER must by definition be low. A ball put in play by the Yankees must have a lower probability of being turned into an out. This causes the model to underestimate the fielding ability of opponents, and over estimate the fielding ability of the Yankees. If the model contained one parameter, ballpark, then this would be absolutely true. However, there are six parameters, including a vector indicating the direction of the ball. I propose that the Yankees hit better than their opponents not because a random ball in play has a higher probability of falling for a hit, but because the Yankees do a better job of hitting balls where they are tough to field. The following table shows the number of ground balls hit by the Yankees and their opponents by vector:
As you can see, the low probability vectors are 29-30, the shortstop hole, 34-37, up the middle, 41-42, the second base hole, and 44, right down the first base line. I'm not looking at the foul vectors where a ball is always a hit. Breaking these down:
So the Yankees hit more grounders where they are less likely to be fielded, and fewer grounders where they are more likely to be fielded than their opponents. Later I want to look at how the Yankees field home and road. If they field much better at home, then the objection still my have some validity. Posted by StatsGuru at 08:27 AM
| Comments (3)
| TrackBack (0)
November 25, 2007
Probabilistic Model of Range, Pitchers, 2007
Permalink To complete the survery of range, here are how pitchers rank. First the teams:
The Padres not only induce the most predicted outs back to the pitcher, they exceed those outs by a great deal. Maddux is one reason:
Peavy is also very good, however. Looking at Schilling's low ranking should give his opponents a clue as to his weakness next season. Bunting for hits against Curt might be a very good idea. Posted by StatsGuru at 07:26 PM
| Comments (4)
| TrackBack (0)
November 21, 2007
Probabilistic Model of Range, Catchers, 2007
Permalink Fielding by catchers isn't the most important aspect of the job, and the number of outs attributed to the postion are few. But for completeness, here are the tables for the position. First, teams:
The Mets are Brewers, who just completed a trade at the position, came out at the bottom team wise. New York might have been better off with Torrealba, at least fielding wise.
Two of the old men, Posada and Ivan Rodriguez, are still cat like behind the plate. Posted by StatsGuru at 01:21 PM
| Comments (4)
| TrackBack (0)
November 17, 2007
Probabilistic Model of Range, Firstbasemen, 2007
Permalink Here's a look at the range of first basemen. First, the team table. The Yankees at least did a good job of improving their defense at the position:
It looks like the Nationals missed Nick Johnson's glove at first base. It's even more evident in the individual listing:
Once again, Albert Pujols comes out on top among every day first basemen. If the Yankees had kept Miguel Cairo off first, they might have finished first as a team. Not only did Nomar not hit like a first baseman, he didn't even field well. Correction: Cairo, not Cabrera. Posted by StatsGuru at 08:04 PM
| Comments (3)
| TrackBack (0)
November 16, 2007
Probabilistic Model of Range, Leftfielders, 2007
Permalink Here's something the Orioles excelled at during 2007, fielding by leftfielders:
Among individuals, Matt Diaz had a career year with the glove as well as the bat.
There's no real surprises at the bottom of the list. Bonds, however, fell off quite a bit. He was average in 2006, but well below average in 2007. You can also see that there are few regular leftfielders. Only twelve players on the list were on the field at that position for at least 3000 balls in play. Posted by StatsGuru at 03:35 PM
| Comments (2)
| TrackBack (0)
November 15, 2007
Probabilistic Model of Range, Rightfielders, 2007
Permalink The following table presents probabilistic model of range data for team rightfielders:
As shown below, Jayson Werth and Shane Victorino made quite the dynamic duo in rightfield for the Phillies. My uncle Anthony will not be happy with this list, however. He's a Yankees season ticket holder and he loves to tell me how much Bobby Abreu is afraid of the wall. It looks like he's still getting to lots of balls.
Mark Teahen did a much better job of adjusting to rightfield than Ken Griffey, Jr. Of course, Junior is old and slow, and with all the injuries might be better off as a DH in AL at this point. Posted by StatsGuru at 04:04 PM
| Comments (10)
| TrackBack (0)
November 13, 2007
Probabilistic Model of Range, Third Basemen, 2007
Permalink The Washington Nationals and Ryan Zimmerman lead the way at third base.
Given that David Wright scores better than Alex Rodriguez, if the Mets sign A-Rod, they should move him to first.
The bottom three on the list pretty much define all-hit and no-field. Posted by StatsGuru at 06:24 PM
| Comments (2)
| TrackBack (0)
November 12, 2007
Probabilistic Model of Range, Second Basemen, 2007
Permalink Here are the PMR numbers for second basemen. First the team stats.
Looking at the teams at the bottom of the list, old second basemen are a detriment to defense. Not only did Biggio at second not help the Astros offensively, it hurt them defensively as well. Now for the individual players.
Rickie Weeks and Dan Uggla need to be at the top of their offensive games to stay at this important defensive position. Correction: Fixed caption on first table. Posted by StatsGuru at 08:59 AM
| Comments (14)
| TrackBack (0)
November 11, 2007
Probabilistic Model of Range, Centerfielders, 2007
Permalink Here are the team rankings for centerfielders:
The Mariners come out on top of the Red Sox overall, but Boston has the better individual fielder:
Note to that the shift of Bill Hall to center worked neither offensively nor defensively. Andruw Jones may not be as good as he once was, but he can still go get the ball. Posted by StatsGuru at 11:55 AM
| Comments (11)
| TrackBack (0)
November 08, 2007
Moving Jeter
Permalink Phil Allard calls for Jeter to be moved to another position based on his poor fielding. I will say this again just so his fanboys won't think I am engaging in gratuitous Jeter bashing: The right move for the Yankees would have been to move Jeter to center when they acquired A-Rod, and push Bernie to DH. Posted by StatsGuru at 01:19 PM
| Comments (24)
| TrackBack (0)
November 07, 2007
Probabilistic Model of Range, Shortstops
Permalink A number of people are suggesting new ways to construct the models, but before I try those methods I'd like to present the model used last year for the nine fielding positions, starting with shortstops. I am including something new, however, the full team at the position.
The above table will give you an idea of how the regular shortstop fit in the team context. You might imagine that Troy Tulowitzki was very good and Derek Jeter very bad:
Troy really blew the competition away in terms of PMR, and Tony Pena did his best to make up for his poor hitting. And while New York enjoys two fine offensive shortstops, neither exactly sparkles with the glove. You can also see why the Tigers are moving Carlos Guillen to first. Michael Young may not be far behind him. Posted by StatsGuru at 10:59 PM
| Comments (15)
| TrackBack (0)
November 06, 2007
Thar's Gold in them thar Gloves!
Permalink Rawlings presented the 2007 Gold Glove winners today. Maddux set a record with his 17th. David Wright won at third base, which I think would make it difficult for the Mets to move him to first if they sign A-Rod. Four outfielders won the NL award as there was a tie in the voting. Posted by StatsGuru at 06:15 PM
| Comments (8)
| TrackBack (0)
November 05, 2007
Probabilistic Model of Range, Defense Behind Pitchers
Permalink One thing PMR can measure is the luck of pitchers by looking at the predicted DER and actual DER behind them. The following table rates pitchers with at least 300 balls in play against them:
Chien-Ming Wang comes out on top by far, not surprising given the Yankees overall defensive rating. What bothers me about Wang, however, is the low level of his predicted DER. You would think that someone who gets a lot of ground balls would be somewhat higher. The following chart breaks down Wang by ball in play type:
Notice that the defense behind Wang caught a lot more line drives than predicted. Line drives tend to fall for hits, so by adding thirteen extra outs with liners, the Yankees really helped Wang. So Chien-Ming got a bit lucky that way. The grounders, however, is where the defense really shined. They picked up about twenty one more outs than expected on ground balls. How did they do that? The Yankees made a lot of plays on low probability vectors:
The vectors go from a low of 28 at the third base line to a high of 44 at the first base line. By looking at the Predicted DER column, you can see where the holes are in the infield. Vector 30 represents the hole between third and short, vectors 34-37 the area around second base where ground balls go into centerfield, and vector 41, the hole between first and second. Note that Wang does well in the holes, as if the defense were shifted a bit toward first base. Both the line drive and ground ball data make me wonder if someone was doing a very good job of positioning the Yankees fielders. I don't know who was in charge of that, but in the case of Wang, they did a very good job. That brings up a point I haven't made in a while. Range is probably a poor word for the ability measured here. Range implies that the fielder can move a long way to get a ball. But sometimes anticipating where the ball gets hit is just as important. So the ability to move and the ability to position are two factors in what the model means by range. On the other end of the spectrum, Matt Cain not only received no run support, he didn't get much defensive support either. And the defense behind Kazmir was just ridiculous. Here's a pitcher who keeps balls in play to a minimum, and his defense can't turn the few hit to them into outs. I'll start on individual positions tomorrow. Posted by StatsGuru at 06:20 PM
| Comments (7)
| TrackBack (0)
November 04, 2007
Probabilistic Model of Range, 2007, Teams
Permalink Baseball Info Solutions sent me their final stats for 2007 over the weekend. That means it's time to start presenting the 2007 Probabilistic Model or Range. If you're new to this, you can find explanations in this archive. Basically, for each fieldable (non inside the park home runs) ball put in play, six parameters are used to determine how difficult it was to field the ball. A probability of turning the ball into an out is calculated, and those probabilities are summed. That gives us expected batted balls turned into outs. We turn that into a predicted DER (defensive efficiency record), compare that to the actual DER and calculate a ranking. The model is based primarily on visiting player data, smoothed, distance on fly balls. Only 2007 data was used to construct the model. Note that a team can post a poor DER during the season, but do well in this model if the balls put into play were extremely difficult to field. In fact, the team ranked first in 2007 is a bit of a surprise for that very reason.
That's right, the Yankees are number one. Without running the individual numbers, I'm guessing that a full season of Melky Cabrera and keeping Giambi off first really helped. The Red Sox defense turned a higher percentage of their balls in play into outs, but they also were given easier balls to field in general. I wondered why the Tampa Bay pitching staff did so poorly with the high number of strikeouts they collected, and the reason is clear in these numbers. The Devil Rays defense was horrible. In fact, the state of Florida just can't play defense, with the Marlins ranking 29th in the majors. For the second year in a row, the Kansas City Royals look a lot better than their posted DER. If they ever get a good set of pitchers on that team, they're going to post a low ERA. For those of you who prefer a ranking by ratio of DER/Predicted DER, here's the table with that data.
Posted by StatsGuru at 08:40 PM
| Comments (34)
| TrackBack (0)
November 03, 2007
Award Winners
Permalink C. Trent Rosecrans interviews John Dewan about the 2007 Fielding Bible awards. Posted by StatsGuru at 12:02 PM
| Comments (0)
| TrackBack (0)
October 31, 2007
Evaluating Defense
Permalink On Baseball and the Reds is writing a series on defensive stats, including how to combine various range data into a better model. Posted by StatsGuru at 03:47 PM
| Comments (0)
| TrackBack (0)
October 15, 2007
Melvin on Defense
Permalink Bob Melvin praises the Rockies defense: "You gotta tip your hat," Arizona Diamondbacks manager Bob Melvin said. "We hit some balls hard. Seemed like every ball we hit hard, someone ended up making a good play, whether it's in the outfield or infield. The Rockies DER this season was .703, which is remarkable given their ballpark. Lots of hits tend to fall in the big outfield. I can't wait to see what PMR says about their team defense. Posted by StatsGuru at 09:13 AM
| Comments (1)
| TrackBack (0)
October 07, 2007
Missed it by That Much
Permalink Coco Crisp almost makes a great defensive play in centerfield on Izturis. Crisp dives and gets the ball in his glove, but he loses it as he hits the ground. Izturs gets a double, the first extra-base hit allowed by Schilling in the game. Update: Kendrick grounds to second, moving Izturis to third. The Angels don't have that many outs left, however, so even productive ones are costly. Update: Rivera pops out to first on a split-finger that was sinking fast. Schilling's doing a great job today of keeping the Angels hitters off balance. Update: Schilling strikes out Napoli to end the inning and get a short shutout. At 100 pitches, Curt is unlikely to come out for the eighth. It's an impressive outing that seems to be the norm for the new Schilling. He strikes out just four, and he only walked one. Instead of striking out a lot of batters, Schilling is causing them to hit the ball poorly. He's getting a lot of outs even with a lot of balls in play. The Red Sox defense helps there as well. Posted by StatsGuru at 05:30 PM
| Comments (0)
| TrackBack (0)
September 16, 2007
Two for Two
Permalink The Phillies load the bases with two outs in the second inning, but Oliver induces a ground ball to short. Ruiz was cutting in front of Reyes as the ball approached him, and Jose booted the grounder. He recovered and tried to throw to second, but the runner was already safe and the throw goes through Castillo. Two runs score on two errors by Reyes, and the normally sure-handed Mets defense costs them. Perez continues to walk Phillies, as he walked Rollins to start the game and Eaton to load the bases. He's now walked 14 Phillies in 10 2/3 innings. Posted by StatsGuru at 01:39 PM
| Comments (0)
| TrackBack (0)
September 14, 2007
Melk Delivery
Permalink David Ortiz doubles off the wall in left, then Lowell singles hard to center. I was absolutely amazed that the third base coach sent Ortiz. Posada had to wait a second for David to slide into him. Melky picks up his fourteenth assist of the year, and the Red Sox have two outs and a man on second instead of first and third, one out. Update: Giambi gets eaten up by a hot shot off Drew's bat and the Red Sox score their second run. There's been poor infield defense by the Yankees tonight. Posted by StatsGuru at 08:28 PM
| Comments (0)
| TrackBack (0)
Stone Glove Award
Permalink Jeter's made too poor plays in the first inning. He made a bad throw on a ground by Lugo resulting in an error, and just now he booted a double play ground by David Ortiz, only getting an out at first. How he wins Gold Gloves is beyond me. Posted by StatsGuru at 07:39 PM
| Comments (0)
| TrackBack (0)
August 27, 2007
Defensive Positioning
Permalink A very nice play by the Mariners in the top of the first inning. Willits leads off with a single, then goes on a hit and run with Cabrera at the plate. Orlando hits the ball the other way, just to the rightfield side of second. But Seattle had the shortstop cover on the play, so Lopez was in the perfect spot to make the play, make a quick toss to Betancourt who then completed the double play. They guessed right on that one. Posted by StatsGuru at 10:16 PM
| Comments (0)
| TrackBack (0)
August 23, 2007
Scout the Defense
Permalink Once again, you can help determine the best and worst defenders in baseball. TangoTiger needs your help. He want your opinions of fielders as he puts together The 2007 Scouting Report by the Fans for the Fans. If you watch a lot of games and have opinions on fielders, please take his survey and be part of the wisdom of the crowds approach to quantifying defense. Posted by StatsGuru at 08:30 AM
| Comments (0)
| TrackBack (0)
August 18, 2007
Trick Play
Permalink Posada and Clemens combine for an interesting double play. With Inge on third and Maybin on first, Clemens strikes out Thames. Maybin was running, and as Posada threw, Inge broke for the plate. But Posada threw the ball to Clemens, not second base. Roger ran down Brandon for the second out to end the inning. Roger has the strikeout pitch working today as he's K'd six through three innings. The Yankees lead 1-0 on a Posada homer as it's a Jorge Day on both sides of the ball. Update: Maybin hits his first home run, a shot to straight-away center. The solo shot in the fifth gives the Tigers a 2-1 lead. Posted by StatsGuru at 04:49 PM
| Comments (3)
| TrackBack (0)
August 14, 2007
Poke by Pronk Procured
Permalink In the bottom of the eight in Cleveland, Byrdak walks two batters with two out to bring up Travis Hafner. He lines one to left center, where Granderson lays out to make a fantastic diving catch to keep the game tied. If Detroit wins this one, Curtis gets the game ball. Update: In the bottom of the ninth, Chris Gomez leads off with a double. That brings up Peralta against Rodney. Jhonny was 0 for 8 vs. Rodney with three Ks. However, he's batted very well this season with men on base and with runners in scoring position. The announcers thought Peralta should bunt, but Wedge has him swing away and he strikes out on a heater right down the middle of the plate. I could go either way on this one, but it seems Peralta has a decent chance of ending the game by letting him swing away. Update: Rodney strikes out the final two batters in the inning. They'll go to extra innings. The Indians struck out 13 times in the first nine, Detroit 11. Posted by StatsGuru at 09:38 PM
| Comments (0)
| TrackBack (0)
August 13, 2007
Base Runner Kills
Permalink The Phillies defeated the Braves 5-3 tonight to take second place in the NL East. But Jeff Francoeur kept the Braves in the game with two base runner kills. That brings Jeff's total of outfielder assists to seventeen, six more than anyone else in the NL. I suspect coaches will stop sending runners on Francoeur soon. Posted by StatsGuru at 12:06 AM
| Comments (0)
| TrackBack (0)
August 10, 2007
Off the Glove
Permalink Johnny Damon and Derek Jeter reach bases leading off the third inning on balls that could have been outs. Both went for hits. The first was a pop up behind second that just ticked off Peralta's glove, but he didn't take a great route to the ball. I would have given him an error. The second was a grounder up the middle by Jeter. Peralta dived for the ball, and it just ticked off his glove to put runners at first and third. Then Abreu hit one up the middle, Peralta fielded it on the first-base side of second, but Barfield didn't cover, and by the time Jhonny was able to tag second, he couldn't get the double play. The Yankees lead 3-0 in the third. Posted by StatsGuru at 07:50 PM
| Comments (0)
| TrackBack (0)
August 07, 2007
Toronto Throws
Permalink The Toronto Blue Jays show off their arms in the top of the fifth. McDonald made a great throw from deep in the hole to nip A-Rod at first. Then for the second time tonight, Posada gets thrown out trying to stretch a double into a double. Rios got him in the fifth, and Reed Johnson caught him earlier. Finally, McDonald makes another nice play in the hole to force a runner at second to end the inning. The defense kept a 4-0 Yankees lead from expanding. Posted by StatsGuru at 08:41 PM
| Comments (1)
| TrackBack (0)
July 17, 2007
Play at the Plate
Permalink Great play at the plate in the Toronto-New York game. With the score 2-1 Toronto in the bottom of the ninth, Phillips singles and Cairo pinch runs and steals second. Cabrera singles to shallow right, and Miguel tries to score from second. Rios makes a great throw, and Zaun blocks the plate perfectly, flipping Cairo away from home and holding onto the ball for the out. Miguel may have injured his shoulder on the play. Cabrera took second on the throw, then stole third with one out. Damon walks, and Jeter is up with the tying run 90 feet away. Update: Accardo balks to force in the tying run and take away the double play. The great defensive play saves a run, but we'll see if it saves the game. Update: Jeter hits a perfect double play ball to short, as does Abreu to end the inning. Without the balk, the Blue Jays win the game. Instead, the teams go to the tenth tied at two. Update: Robinson Cano singles home A-Rod in the 10th and the Yankees take the game 3-2. The gain a game on the Red Sox and put a little more distance between them and the Blue Jays. Posted by StatsGuru at 10:04 PM
| Comments (0)
| TrackBack (0)
July 04, 2007
In the Neighborhood
Permalink I just saw a very bad example of the umpire giving the second baseman the out on a double play just for being close to the bag. Fontenot took the throw from the third baseman about a foot in front of the bag. The camera work was bad and blurry, but the picture cleared as the camera came to rest on the second baseman. It was clear at that point he was no where near the bag, and there was no runner bearing down on him. You need to be a little closer than that. Posted by StatsGuru at 12:57 PM
| Comments (0)
| TrackBack (0)
July 03, 2007
No Defense
Permalink The Milwaukee Brewers made four errors this afternoon, and at least one other bad play that went for a triple as they lose to Pittsburgh 6-2. The errors led to two unearned runs. Milwaukee had opportunities to score. They loaded the bases in the second but did not score. Shane Youman gave up eight hits, a walk and a hit batter in six innings of work, but allowed just two runs. Last year, despite walking ten and striking out just five in 21 2/3 innings, he posted a 2.91 ERA. It appears this pitcher bends but he doesn't break. Posted by StatsGuru at 07:16 PM
| Comments (0)
| TrackBack (0)
June 28, 2007
Positioning as Range
Permalink The Twins came up in the bottom of the ninth inning last night trailing 5-4 with Joe Mauer leading off the inning. Joe smacked a hard grounder up the middle, and off the bat I thought, "There's a hit." But as the camera turned to show the field, Royce Clayton was crouching in front of the ball, and made an easy play for an out. Clayton played Mauer perfectly, and what would be a single in many cases started a 1-2-3 inning for a Toronto victory. The Blue Jays obviously did their homework. And of course, it's so easy to do today. Mauer seldom hits ground balls to the right of where Clayton was stationed. By positioning himself correctly, Royce Clayton is increasing his range without having to move a long distance for a ball. That's why, at some point, I'd love to get positioning information for players, so we can separate those player who can move long distances to get to balls vs. players who know where to stand before a ball is put in play. With the win, the Blue Jays move over .500 and to 9 games behind Boston. Posted by StatsGuru at 07:37 AM
| Comments (3)
| TrackBack (0)
May 31, 2007
Minds Changing?
Permalink I'm starting to get some positive feedback on this Youkilis-Helton video. Posted by StatsGuru at 10:17 PM
| Comments (1)
| TrackBack (0)
May 25, 2007
Warning Track Robbery
Permalink Jason Michaels shows off his vertical leap as he skys over the fence in left to steal a home run from Craig Monroe. The Tigers picked up three straight hits, a triple by Guillen and singles by Rodriguez and Casey to cut the lead to 2-1. Monroe's shot would have put the Tigers up 4-2. Who says white men can't jump? Posted by StatsGuru at 07:34 PM
| Comments (0)
| TrackBack (0)
May 23, 2007
Where's the Wall?
Permalink Hunter Pence makes a catch off Rich Aurilia at the 404 sign in centerfield. He was feeling for the wall, and thought he was close. He leaped for the ball, caught it, and looked like he thought he would crash against the padding. Instead, he fell over and hit his head in the seam where the wall angles in toward left. It was a scary crash, but Hunter held on and stayed in the game. If he was more aware of his position, he could have just kept going back to make the catch without leaping. Posted by StatsGuru at 11:18 PM
| Comments (1)
| TrackBack (0)
May 21, 2007
Catching Flies
Permalink John Lowe reviews the Tigers outfield defense. It's a group effort: The outfielders don't flip the ball to each other for outs like Carlos Guillen and Placido Polanco do. But they consider their defense a collaboration. In the 1980s I used to sit in the centerfield bleachers at Fenway Park. I was always amazed that teams would come in that didn't do anything to position outfielders. No matter the hitter, they played everyone straight away. It's good to see the Tigers thinking about this and putting a plan into action. Posted by StatsGuru at 10:34 AM
| Comments (0)
| TrackBack (0)
May 20, 2007
Kendall Shift
Permalink Jacob Lous attended the Oakland game today and sends a word on Jason Kendall: One of the craziest things to watch in baseball this year is the Jason Kendall shift. His name is announced, and three outfielders instantly start jogging - jogging - to a new spot. I've never seen anything like it. Kendall broke up a no-hitter recently because of this shift. Posted by StatsGuru at 09:04 PM
| Comments (2)
| TrackBack (0)
May 19, 2007
Shades of Willie Mays
Permalink The Braves are losing 8-0 in the bottom of the sixth, but Andrew Jones just channelled Willie Mays. On a ball to deep centerfield, Andruw ran straight back, looking over his right shoulder, and made a basket catch for the out. Here's the Mays catch. Both are pretty plays. Posted by StatsGuru at 03:06 PM
| Comments (2)
| TrackBack (0)
May 14, 2007
With Teammates Like These
Permalink Orlando Cabrera clocks Reggie Willits in the jaw as they both go for a fly ball down the line in leftfield. Cabrera was calling for the ball but it's not clear that Willits did also. Cabrerra made the catch, and ran the ball in to prevent Blalock from scoring from third while Willits lay on the ground. Reggie stayed in the game. Kevin Millwood re-injured his hamstring. He gave up a grand slam to Kotchman in the first, and the Angels lead 4-0 in the top of the third. Posted by StatsGuru at 02:55 PM
| Comments (0)
| TrackBack (0)
May 13, 2007
Two Nice Plays
Permalink The Mariners turn two pretty plays in the top of the third. Phelps hits a bouncer in the hole that Betancourt backhands, jumps and throws to beat Phelps by a mile. He made the catch and throw in one smooth motion. Then Cano hit a nubber between the catcher and the pitcher toward third base. Ramirez was quick off the mound, made a strong throw but wide, but Sexson used his height to stretch, catch and hold the bag for the third out. Posted by StatsGuru at 04:44 PM
| Comments (2)
| TrackBack (0)
May 09, 2007
Fielding, Too
Permalink Brew Crew Ball notes a number of good defensive plays by the Brewers last night. They're not a great defense right now. The Hardball Times puts their DER at .694, tied for eighth in the NL. But THT's +/- rating assigns better numbers to the fielders than the pitchers, so in fact Milwaukee's defens is doing a pretty good job. Posted by StatsGuru at 08:28 AM
| Comments (0)
| TrackBack (0)
May 05, 2007
Right On Crisp
Permalink Earlier today I discussed a Bill James observation that Coco Crisp played an excellent centerfield over the last two weeks. I've looked that the probability of his putouts using last year's probabilistic model of range (PMR). Bill was right on. This season, Crisp caught nine balls that weren't caught last year. There was a small sample size on each of those, so zero might not be accurate, but nine of those catches came in the last two weeks. Overall, he caught fifteen balls where the probability was less than or equal to .5, and 13 of those came from 4/23 on. If I had data on balls he didn't catch, we could do a complete analysis, but it sure looks like Bill's observation is true, that over the last two week Crisp is making difficult plays. Posted by StatsGuru at 08:27 PM
| Comments (1)
| TrackBack (0)
Crisp in Center
Permalink Bill James sent an e-mail to a few sabermetric friends this afternoon praising Coco Crisp. Seth Mnookin posted here. The main quote from James: "It seems to me that the BIGGEST factor in our team's performance over the last week or so has been that Coco has been just unbelievable in center field...he's just catching EVERYTHING that looks like it might be trouble. There's been no gap in right center, no gap in left center, nothing getting over his head and nothing has been landing in front of him." Seth gives an example from Friday night's game. I was able to obtain data on Crisp's putouts, and since April 23rd, Coco started seven games, collecting 34 putouts or about five a game. In his previous 15 starts, Coco recorded 41 putouts, or less than three per game. So over the last couple of weeks, Crisp is up about two putouts per game. There's not a lot of context here. I don't know if more balls are being hit in his general area. But I'm trying to get a handle on the degree of difficulty of the catches, and I'll post when I have something on that. Update: Here's a chart of Crisp's putouts this season. Second base is at 180 degrees. (Click for a larger image.)
As you can see, he's catching balls close and far, and he's covering thirty degrees of the field. Posted by StatsGuru at 03:30 PM
| Comments (0)
| TrackBack (0)
April 29, 2007
Defense in Center
Permalink A ball just dropped between Jason Kubel and Torii Hunter because Torii didn't do his job as a centerfielder and try to catch everything. He jogged after a ball he thought Kubel could catch, rather than running full speed and calling Kubel off. Kubel thought Hunter would get the ball, and it fell for a hit to put runners on first and second with one out. Update: Santana gets a strikeout and ground out to end the inning. No score at the end of two in Detroit. Posted by StatsGuru at 01:46 PM
| Comments (2)
| TrackBack (0)
April 22, 2007
Shifting Gears
Permalink Manny Stiles documents the Pronk shift, used against Travis Hafner last night. Posted by StatsGuru at 11:01 AM
| Comments (2)
| TrackBack (0)
April 21, 2007
Strange Error
Permalink Nate Robertson picks up an error on a throw to first, because he faked out his own first baseman. Nate takes off his hat and is wiping his brow when he throws quickly to first. Casey, seeing Robertson apparently taking a moment, takes off his glove for an adjustment. The ball sails by, and Ozuna ends up at second. He's at third after a single, and ties the game on a sacrifice fly by Thome. Posted by StatsGuru at 02:08 PM
| Comments (2)
| TrackBack (0)
April 06, 2007
Manny Being Man-D
Permalink Manny made a bad throw earlier today, so I should I should praise a good defensive play as well. He just made a nice running catch over his shoulder as he ran back toward the leftfield wall, just on the edge of the warning track. The fact that Manny can make plays like that is one of the infuriating things about his defense. You get the feeling sometimes he doesn't try. Posted by StatsGuru at 03:53 PM
| Comments (2)
| TrackBack (0)
April 04, 2007
Another Great Catch
Permalink Gary Matthews, Jr. just made another great catch, robbing Michael Young of a home run at the centerfield fence. He's making the Rangers really miss him. Update: Matthews then leads off the inning with a high chop that lands behind McCarthy for a single. A wild pitch and two singles later the Angels lead 1-0. Not surprisingly, Guerrero drove in the run with another hit against the Angels. Update: The Angels score four in the first, ruining McCarthy's debut with Texas. Posted by StatsGuru at 03:42 PM
| Comments (0)
| TrackBack (0)
Turning Two
Permalink The Mets pitchers so far allowed a .348 OBA. That's high for a staff. But that number gets cut down by the number of ground double plays induced. Overall, New York pitchers allowed 16 Cardinals to reach base via a hit, walk or hit by pitch in sixty nine plate appearances. But if you remove the seven runners taken out on double plays, the effective OBA against the Mets is just .246, which is excellent. Posted by StatsGuru at 08:18 AM
| Comments (0)
| TrackBack (0)
March 30, 2007
More Defensive Calculations
Permalink On Baseball and the Reds is doing nice work with The Hardball Times defensive numbers, coming up with a way to convert THT's zone ratings to a +/- system. The Probabilistic Model of Range lends a hand. What's nice about this is that it looks like something that can be calculated during the season. Correction: Fixed the link. Posted by StatsGuru at 07:08 PM
| Comments (2)
| TrackBack (0)
March 27, 2007
Brown's Frown
Permalink Emil Brown fights back against criticism of his defense: Emil Brown glanced at the lineup card Sunday morning in the Royals' clubhouse, turned and observed to anyone within listening distance: Emil makes a good point. If you look at his defensive charts for 2006, Brown isn't a star defender, but he's basically making the plays. It doesn't matter how smooth you look catching the ball, as long as you make the catch. Posted by StatsGuru at 09:04 AM
| Comments (6)
| TrackBack (0)
March 25, 2007
Probabilistic Model of GDPs
Permalink A few days ago I introduced the idea of a probabilistic model of Ground into Double Plays (GDP). The probabilistic model of range just measures the ability to turn a ball into an out. For infielders, however, they're often asked to turn a ground ball into more than one out. The idea is to take a very specific situation; ground ball hit, man on first, less than two out and build a model that measures both plays made and GDP turned. With that model, we can ask which fielders perform well in that situation. In building this model, I left parks out of the parameters. Basically, I thought the sample size would be too small if I left the parks in. This probably hurts the three teams that play of artifical turf. Let's start by looking at the ability of shortstops to start a double play. The following table looks at three indexes for each fielder. The Plays Made (PM) index measures Plays Made / Predicted Plays Made. This measures the fielder's ability to turn a ball into an out. The GDP index does the same for ground double plays. Does the fielder start the expected number of double plays? And finally, an outs index that looks at the total number of outs accured to the fielder on these balls in play. It could be a fielder is making up for a lack of range by being really good at starting GDPs, or vice versa. Remember, this says nothing about the pivot man or the receiver at first base. In this context, we're only looking at the fielder who starts the play.
The other thing that strikes me about the list is that shortstops who are good at making plays are also the ones good at starting double plays. Ronny Cedeno is unusual in that he's good at getting an out, but didn't do well starting DPs. Could it be that Todd Walker was just a poor pivot man? I hope further research using these models will help answer that question. Posted by StatsGuru at 11:46 AM
| Comments (2)
| TrackBack (0)
March 17, 2007
Manny's Defense
Permalink Dan Rosenheck looks to see if Manny Ramirez's defense is hurting his value to the Red Sox (full disclosure, I was consulted on the article): The truth most likely lies in the middle: the average of the P.B.P. systems' results for Ramírez is 15 to 20 runs below average. That's enough to take a significant bite out of his value. If his hitting begins to deteriorate this season (he turns 35 in May), and his base running remains poor (subtracting another two runs or so), he is likely to be worth about as much in 2007 as Oakland's up-and-coming Nick Swisher. In other words, an All-Star, but not a franchise player, and certainly not worth anywhere near his $20 million salary. I put the cost of Manny in left field at no more than 16 runs in 2006, whereas Dan believes that the minimum. Dan is also basing Manny's worth on Ramriez's worth on his continuing at that level of defense and his offense declining due to age. But of the three years I've measured Ramirez, 2006 was by far the worst reading I've seen on him. Manny complained of a bad right knee in 2006. If that's better and he becomes more mobile, I suspect the number of balls he gets to goes up as well. So I'm not quite as dire as Dan in assessing the worth of Ramirez. He a great player in his mid 30's, and I'm not surprised he is showing signs of decline. Posted by StatsGuru at 09:30 AM
| Comments (5)
| TrackBack (0)
March 16, 2007
Increasing Range
Permalink Miguel Tejada took complaints about his lack of range seriously this off season. He's come to camp in excellent shape and is actually working on increasing the area he can cover: Shiner said Tejada's workouts have been focused on improving his foot speed and movement. During one drill, Tejada shuffles back and forth between cones as Shiner rolls baseballs to him. The exercise is designed to maximize the steps to get to the ball, simulating the act of fielding a baseball while moving left or right. Team officials have been pleased with the range Tejada has shown thus far in camp. We'll see if his PMR improves at the end of the season. Posted by StatsGuru at 02:56 PM
| Comments (1)
| TrackBack (0)
March 15, 2007
The 270
Permalink Via Dodger Thoughts, there's a new trick play in baseball: Born in the imagination of a minor-league pitching coach, carried from Class A to the brink of the big leagues by an over-achieving, side-arming right-hander, "The 3-2" is a pick-off move that is challenging umpires at least as much as it is eliminating baserunners. I can't find a link to the video on Google or YouTube, so if someone finds it let me know. Posted by StatsGuru at 04:49 PM
| Comments (3)
| TrackBack (0)
February 28, 2007
Differing Views
Permalink Two views of Kenji Johjima's defense are offered by Prospect Insider and Detect-o-Vision. Range isn't a good measure of defense for catchers, but PMR is neutral on Johjima. That says to me he moves as well as most catchers. It's a pretty small sample size, however, as you can see from his charts. Posted by StatsGuru at 09:00 AM
| Comments (1)
| TrackBack (0)
February 26, 2007
Angels in the Outfield
Permalink It looks like the Angels are on the verge of a huge improvement in their outfield defense. Not only is Matthews going to take pressure of Vlad Guerrero, Garret Anderson's feet are healthy again: But the Angels' veteran left fielder also was somewhat offended by media reports framing the Matthews signing as one that would ease the burden on Anderson and right fielder Vladimir Guerrero. Vlad was actually okay on fly balls last year. He basically performed up to expectations. It was Anderson who needed help in the gaps. If Garret's feet are indeed better, we should see good fielding across the board in the Angels' outfield. Posted by StatsGuru at 07:53 PM
| Comments (1)
| TrackBack (0)
February 20, 2007
Back to School
Permalink I'll be attending Andy Andres Sabermetrics 101 class tonight for the lecture on defense. Required reading this week was the PMR archive. Posted by StatsGuru at 08:48 AM
| Comments (1)
| TrackBack (0)
February 19, 2007
Emphasis on Defense
Permalink Ron Washington drilled into the Texas pitching staff the importance of fielding their position, using the Detroit Tigers World Series performance as an example. The pitchers then went through their drills: And so for about 45 minutes on Sunday, Rangers' pitchers shuttled through three different stations. It's amazing to me that pitchers don't do defensive drills during the season. Once a week for 45 minutes, would likely be good for all of them. Posted by StatsGuru at 10:33 AM
| Comments (1)
| TrackBack (0)
February 16, 2007
Where's Griffey
Permalink It looks like Ken Griffey, Jr. is going to start the season in centerfield for the Reds. Red Reporter disagrees. Why is there so much dismissal of Chris Denorfia? The Reds don't seem to take him seriously, which is bizarre to me because you'd think he'd fit the profile of what Krivsky likes in a player. His effort level is off the charts, and he's a good defender. Denorfia owns a very good minor league OBA and a good major league OBA for a good defensive centerfielder. He's 27 for the 2007 season, and should be at the top of his game. He'll likely get on base at a .360 clip and catch the ball. I agree with Red Reporter, it's an obvious move, especially given Griffey's poor range. Posted by StatsGuru at 04:24 PM
| Comments (0)
| TrackBack (0)
February 15, 2007
Kills and Holds
Permalink John Walsh delivers his outfield arm rankings for 2006 at The Hardball Times. I especially like the graph he includes, showing where the outfielders lie on a runners held vs. runners killed basis. The upper right quadrant is fascinating. It's the quadrant where fielders are good at both, but within that quadrant an increase in an ability to kill a runner leads to a decrase in the ability to hold a runner. So no one comes close to being great at both. Posted by StatsGuru at 03:55 PM
| Comments (1)
| TrackBack (0)
February 14, 2007
Pie vs. Patterson
Permalink Felix Pie's defense is the reason the Cub Reporter thinks the rookie will get more time to develop than Corey Patterson: Is Felix Pie ready, then? Probably not, if ready means doing much more than flashing his offensive potential. But great athletes learn to hit, largely because their defense buys them the time that Jason Dubois won't have. Meanwhile Pie can anchor center field, which is something, not nothing. Cub fans in particular might have a problem with this patient approach because it didn't work with Corey Patterson. We waited and waited and he never got better. Posted by StatsGuru at 12:54 PM
| Comments (8)
| TrackBack (0)
January 28, 2007
Helton vs. Youkilis
Permalink Here's my latest video, a quick look at Todd Helton and Kevin Youkilis fielding grounders. Here's the full set of charts for Helton and Youkilis. Posted by StatsGuru at 06:44 PM
| Comments (4)
| TrackBack (0)
January 22, 2007
Soriano in Center
Permalink Over the weekend, Alfonso Soriano agreed to play centerfield, opening up a spot for Cliff Floyd on the Cubs roster. The Floyd deal, which might be completed this week, has been in the works since the winter meetings, but the Cubs weren't sure whether they would add Floyd or a veteran center fielder to hold down the fort until prospect Felix Pie is ready at midseason. Floyd, a former Thornwood star, is expected to serve as a fourth outfielder, giving left fielder Matt Murton and right fielder Jacque Jones regular rest. So does this push Pie back in the depth chart? Or will the Cubs look to make a trade once Pie is ready to play? Posted by StatsGuru at 07:55 AM
| Comments (6)
| TrackBack (0)
January 07, 2007
Combining Metrics
Permalink Lee Panas combines four measures of range into one by treating them as four voting systems and averaging the ranks. We used to do this sort of combination when I worked in information retrieval and we wanted to combine the results from multiple search engines. In general, it's a good way to combine various opinions. Posted by StatsGuru at 03:11 PM
| Comments (0)
| TrackBack (0)
January 05, 2007
Defensive Positioning
Permalink I'd like to explore positioning as part of the Probabilistic Model of Range. One thing that I believe would be easy to record is the direction and distance the fielder moved to get to a ball. The direction could be coded using the digits 1-9 as follows:
Where 5 would be straight at the fielder, 8 would be in front, 4 to the fielder's right, etc. What I'd like to get opinions on is if the X and Y axis should be fixed for all fielders or float depending on the position. For centerfielder and pitchers, the X axis would be a line that went through home plate and second base, while the Y axis would go through third and first. But for a shortstop, the X axis could go through second and third base, with the Y axis perpendicular to that. In the case of a fixed axes through 2nd-home and 3rd-first, a ball in the hole that's fielded by the short stop would be coded a 7. In the second case, where we adjust the axes to the fielder, it would be a 4, since the fielder moved to his right. My feeling is the second way is superior. However, with so many shifts being employed now, which often put the shortstop on the second base side of the bag, the fixed axes approach might be more accurate. I'd like to hear your opinions on the matter. Posted by StatsGuru at 01:25 PM
| Comments (9)
| TrackBack (0)
November 29, 2006
James on Defense
Permalink Baseball Digest Daily interviews Bill James on the 2006 Fielding Bible Awards. Here he talks about Mike Lowell: Mike Lowell is the best defensive third baseman in baseball. He's extremely interesting to watch. He keeps his glove hand, his left hand, very relaxed, and he doesn't appear to anticipate the hop at all. What I am saying is. .. the announcers, the veteran baseball people will tell you that the key to making the plays is to get your body in the proper position to make the play. But in fact, if you actually watch the fielders, very often they can't handle a tough hop or a line drive at an awkward angle precisely because they're trying to play the ball with their whole body. They're relying on positioning their body to make the play, and when something happens that makes that impossible, they're just SOL. Lowell, if you watch him, seems to be saying "it is easier to react with my left arm than it is to re-position my whole body in anticipation of the play." He stays balanced, stays loose, reacts late and has extraordinary confidence in his ability to snag the ball with his glove at the last moment. I've never really seen anything like it before, but this looseness and unusual confidence, for example, gives him a remarkable ability to charge a ground ball. He can change a slow grounder top speed because he knows that, bad hop or good hop, in-between stride or on stride, he can slap at the ball with his glove and pick it out of the air. The interview is definitely worth the read. Posted by StatsGuru at 07:50 AM
| Comments (6)
| TrackBack (0)
August 23, 2006
Fan Scouting
Permalink It's time once again for you to be the scout and help Tangotiger judge defensive ability. I believe this is the third year Tom conducted this survey, using the knowledge of fans to rate the defensive ability of players. The more input he gets, the better his results. So if you watch baseball, go to his site and take part. There is an enormous amount of untapped knowledge here. There are 70 million fans at MLB parks every year, and a whole lot more watching the games on television. When I was a teenager, I had no problem picking out Tim Wallach as a great fielding 3B, a few years before MLB coaches did so. And, judging by the quantity of non-stop standing ovations Wallach received, I wasn't the only one in Montreal whose eyes did not deceive him. Rondel White, Marquis Grissom, Larry Walker, Andre Dawson, Hubie Brooks, Ellis Valentine. We don't need stats to tell us which of these does not belong.
Posted by StatsGuru at 08:12 AM
| Comments (0)
| TrackBack (0)
August 18, 2006
Who's Got It?
Permalink WasWatching reviews the botched popup that made the Orioles blowout a slightly larger blowout. In the YES replays, you clearly see Jeter moving his mouth when the pop is in the air. It appears that he's saying "I got it!" a few times. In the same replays, you never see A-Rod open his mouth, at all. The rule on the Yankees should be that Jeter catches all pop ups, even the ones hit directly at another fielder, to make up for all the ground balls that go through the shortstop position. :-) Posted by StatsGuru at 08:19 AM
| Comments (2)
| TrackBack (0)
August 17, 2006
Cruz Missile
Permalink The Tigers are up 3-0 after three innings, but the bottom of the third ended with Dmitri Young thrown out at the plate by Nelson Cruz. Young was at second with two out when Pudge Rodriguez singled to right. Gene Lamont waved Young around third. Cruz fired home, and Gerald Laird waited a good two second before he needed to make the tag. It's not often you see someone thrown out at the play by 20 feet. Posted by StatsGuru at 08:10 PM
| Comments (3)
| TrackBack (0)
August 10, 2006
Double Them Off
Permalink Correction: I had the wrong numbers this morning. A program I thought was computing GDPs was computing something else. Sorry for the confusion. This post is correct. The Arizona Diamondback turned five double plays last night, setting a team record. The Diamondbacks turned a club-record five double plays - three 5-4-3s, a 4-6-3 and a 1-4-3 - as Batista was able to pick up win No. 10 despite allowing the Giants to begin three innings with back-to-back singles. Arizona ranks third in GDPs induced:
In case you're wondering if it's all Orlando Hudson, the team ranked eighth in 2005 with 140. Posted by StatsGuru at 08:50 AM
| Comments (2)
| TrackBack (0)
July 17, 2006
Playing D
Permalink Sean Brennan at the New York Daily News notes the good defensive play by the Yankees yesterday. In the third inning, it was Guiel's turn. With one out and runners again on the corners, Paul Konerko hit a liner to right field for what looked like a single. But Guiel fired a strike to Derek Jeter at second to get a rare 9-6 force-out on Jim Thome for the inning's second out. Though a run scored on the play, pulling the Chisox within 3-2, the play slammed the door on a possible big inning for Chicago. Posted by StatsGuru at 08:42 AM
| Comments (0)
| TrackBack (0)
July 04, 2006
Fantastic Catch
Permalink The Big Lead provides video of Gary Matthews over-the-wall catch. Posted by StatsGuru at 04:35 PM
| Comments (1)
| TrackBack (0)
June 23, 2006
Pitching and Defense
Permalink An excellent piece of research here by the Baseball Crank on how great pitching teams are almost always supported by great defenses. Posted by StatsGuru at 10:56 AM
| Comments (2)
| TrackBack (0)
June 22, 2006
90% of the Game in Mental...
Permalink Sheldon Ocker details the mental collaspe of the Cleveland defense in the third inning last night. I don't hear many calls for Eric Wedge's head. It's seems to me, however, when a team doesn't have its head in the game, that's a good time to blame the manager. I'm interested in Cleveland fans take on Wedge as a manager of people, rather than the game. Posted by StatsGuru at 08:48 AM
| Comments (0)
| TrackBack (0)
June 06, 2006
Melky Way
Permalink Manny Ramirez drives a ball to the 399 foot mark in the left center at Yankee Stadium, and Melky Cabrera leaps and catches the ball, preventing Manny from tying the game. The more I see this youngster play, the more I like him. He's selective at the plate. In the outfield, he can run, catch and throw. His scoring on the wild pitch last night showed his base running ability. The more he plays, the less it looks like the Yankees will need Sheffield next year. Cano, Wang, Phillips and Cabrera remind me of the production of the Yankees farm system in the mid 1990s. Update: Rivera retires the side easily in the ninth, throwing just five pitches to get the side 1-2-3. The 2-1 victory puts the Yankees 1 1/2 games up in the AL East. Posted by StatsGuru at 09:42 PM
| Comments (1)
| TrackBack (0)
June 05, 2006
Yankees Speed
Permalink Melky Cabrera just scored from first on a wild pitch. With Giambi at the plate and one out, Beckett throws a wild pitch that doesn't get too far away from Varitek. Cabrera hesitates, then starts to second. Varitek tries to throw to Lowell who is covering second, and throws the ball into shallow right. Since no one is covering third, Cabrera runs for that base. As he approaches third, he sees Varitek running up the line to cover third. Melky decides to race Jason to the plate and easily wins to score the first run of the game. It's a wild pitch and an error on the throw by Varitek. The Yankees lead 1-0 after one. Posted by StatsGuru at 07:29 PM
| Comments (0)
| TrackBack (0)
May 19, 2006
Diamondbacks Double Plays
Permalink Nick Piecoro notes the Diamondbacks are leading the majors in turning double plays, and are on a pace to shatter the major league record. Hudson, one of the best defenders in the game last year, is benefiting from Counsell's knowledge of the hitters: That has a lot to do with positioning, and Counsell regularly passes along some insights to Hudson during innings. Hudson said that several times this season Counsell has all but predicted a ground ball going to second base. The downside of breaking a record for double plays, of course, is that there are a lot of batters reaching base. But the double plays turned effectively reduced the OBA of the Diamondbacks opposition from .344 to .312. In Bill James book, The Managers, Bill notes that Casey Stengel always tried to put a good double play combination around second base. He didn't mind pitchers who walked a lot of batters, as long as they got ground balls that could be turned into double plays. It's quite possible Arizona adopted that philosophy. Update: I didn't know if the book was still in print, but Amazon sells it (click on the link above). For some reason, it wasn't as popular as other James books, but I think it's his best job of combining the history and strategy of the game and should be read for the Stengel section if nothing else. Posted by StatsGuru at 08:10 AM
| Comments (2)
| TrackBack (0)
May 14, 2006
Stellar Defense
Permalink Rastronomicals at Crawfish Boxes notes how much the Houston defense helped Andy Pettitte earn the shutout today. Posted by StatsGuru at 08:02 PM
| Comments (2)
| TrackBack (0)
May 12, 2006
Can't Field
Permalink Tim Dahlberg noticed Barry Bonds' shabby play in left field yesterday: He couldn't stop while lumbering after a foul ball fly in the sixth inning, bonked into the wall, teeter-tottered over and landed upside-down in the stands. Two innings later he couldn't run down a lazy looper near the line and let it go. It was charitably ruled a triple. It strikes me that any ball hit to Bond's left can turn into a double. Hitters need to start thinking that if Bonds has to move at all, turning on the after burner can get you to second safely. Watching yesterday, Barry has a real problem transitioning from the grass to the rubberized warning track. Get a ball near there and a speedster might have an inside the park home run. Posted by StatsGuru at 08:23 AM
| Comments (7)
| TrackBack (0)
May 11, 2006
Barry Tumbles
Permalink Barry Bonds just tumbled into the stands after going after a foul fly ball. He was running toward it when he hit the warning track and tried to slow down. The ball dropped, but Bonds couldn't stop, hit the wall and fell over. He limped back to left field. As a commentor to the previous post pointed out, Bonds is playing more due to the injury to Alou leaving the team short-handed. But that play is a perfect example of why you want to get Bonds out of sure wins or losses early. A play in the field can easily take out his knees. He's due up in the bottom of the sixth. Posted by StatsGuru at 05:16 PM
| Comments (0)
| TrackBack (0)
May 08, 2006
Mr. Robinson's Neighborhood
Permalink Kerry Robinson can't hit, and if yesterday's game is any indication, he doesn't make up for the lack of offense with his glove. The Royals managed to work around one misplay Sunday by center fielder Kerry Robinson. A second one, though, led to the winning run in a 3-2 loss to the Chicago White Sox at U.S. Cellular Field. Mistake one: Robinson's earlier misplay came in the fourth, when he misjudged a fly ball by Crede so badly that second-base umpire Gerry Davis initially signaled a homer. Mistake two, the one that cost them the game: The White Sox had two outs and none on in the eighth inning when Robinson, overshifted to right field against left-handed pull hitter Jim Thome, couldn't corral a high, slicing fly toward left center. He doesn't get on base, he doesn't hit for power, he doesn't catch the ball. Why is he in the majors? Posted by StatsGuru at 08:25 AM
| Comments (6)
| TrackBack (0)
April 26, 2006
To Catch, or Not to Catch
Permalink Josh Bard allowed four passed balls tonight as he teamed up with Tim Wakefield in a 7-1 loss to Cleveland. That gives Bard 10 passed balls on the season, seven more than any other catcher in the league. Last year, Bengie Molina led the majors with 10. In this century, only Jason LaRue has as many as 20 in a season. No one's had over 30 since Gino Petralli in 1987. Bard's on a pace for 60. Posted by StatsGuru at 11:07 PM
| Comments (5)
| TrackBack (0)
April 17, 2006
Unusual Play
Permalink Randy Winn just doubled up the gap in right center. Shawn Green managed to just cut off the ball, but he needed to backhand the roller and ended up turned toward the outfield wall. He then tried to flip the ball to Byrnes so Eric could throw it in, but Byrnes was ducking so he'd be out of the way of the throw. The ball goes over Byrnes' head, and Fassaro and Winn both come around to score. It's 4-0 Giants in the top of the second. Posted by StatsGuru at 10:14 PM
| Comments (1)
| TrackBack (0)
Throwing High
Permalink Manny Ramirez just grounded out to Yuniesky Betancourt. Every time I've seen Betancourt throw in this game, I thought he sent the ball sailing high. Then as the camera pans, I realize Richie Sexson is playing first, and Yuniesky is just throwing the ball chest high. Posted by StatsGuru at 01:29 PM
| Comments (0)
| TrackBack (0)
April 10, 2006
Padres Defense
Permalink Friar Faithful looks at the pitching lines from yesterday's blowout in San Diego and finds the defense at fault, rather than the pitching: How did we get the result we got then? Two factors: Awful fielding and bad luck. A lot of both, actually. We can only hope for a change in the latter, but the former we can expect to improve. Cameron's return from the DL will vastly improve the outfield. Dave Roberts cannot play a credible centerfield and I really can't say enough about how much I detest seeing Eric Young in the starting lineup. I won't wish injury on anyone, but we have a better chance of that taking playing time from undeserving veterans than we do of Bochy doing it. Posted by StatsGuru at 07:55 AM
| Comments (1)
| TrackBack (0)
April 04, 2006
No Shakespeare Behind the Plate
Permalink Josh Bard and Tim Wakefield failed to connect tonight. The Rangers found Wakefield hittable, touching him for seven hits and seven runs. Adding to the problem was new catcher Josh Bard, charged with three passed balls. Vicente Padilla benefits from all this, as he's throwing a two-hitter through five. It's 7-0 Rangers in the bottom of the fifth. Correction: Fixed spelling of Vicente. Posted by StatsGuru at 09:34 PM
| Comments (2)
| TrackBack (0)
April 03, 2006
Yankees Defense
Permalink Via Seymour Ruskin, Phil Allard of NYYFans is writing a column on the Yankees for WCBS Radio in New York this year. Congratulations Phil! However, in an otherwise good column about the Yankees defense, Phil succumbs to Jeter myopia: As much as I believe in most forms of objective sabermetric philosophy, such as the all important OBP and the shunning of �productive outs,� I have to disagree here. Yes, Jeter does not have great range, but he adds dimensions of worth to his team that defies quantitative analysis, and there ain�t no stat geek that can tell me otherwise. I can�t let statistical �objectivity� act as a blinding agent to what my eyes can clearly see. (That sound you hear is members of the saber community firing up their keyboards to take pithy shots at me.) If his value is intangible, then it doesn't exist. The most important thing a shortstop does is field ground balls. Jeter does that poorly. You know, when you can't find anything good to say about a catcher, you throw out that he's a great handler of pitchers. When you can't say anything good about Jeter's defense, you point to all the things that aren't measured well, as if being a great cutoff man or making a couple of great foul catches is going to make up for all the balls going through for hits. Jeter is the Yankees shortstop because he ranks high among shortstops when you combine offense and defense. In other words, his offense is making up for his defensive shortcomings. At some point, that may not be true. But even then, the Yankees can't move him from the position. Like Gehrig before him, no one will be able to tell him he can't play. Jeter defines the Yankees of this era. His offense, his leadership, his desire to win makes him the icon of this team. When Jeter leaves shortstop, it will be his idea alone. Posted by StatsGuru at 09:51 AM
| Comments (17)
| TrackBack (0)
April 02, 2006
Taking Defense
Permalink Joe Hamrahi interviews me about the Probabilistic Model of range. Posted by StatsGuru at 07:50 PM
| Comments (0)
| TrackBack (0)
March 30, 2006
Javy to DH
Permalink Playing first base and hitting was just too much for Javy Lopez, so he'll be starting the season as the Orioles DH and backup catcher. "I actually wanted it. I guess the fact that I was working so much at first base during spring training, I kind of (cut) back my hitting," Lopez said. "Sam Perlozzo came up to me and told me, 'It would be a good idea just to start you as a DH so you could get your timing back as a hitter.' I totally agree with it." It looks like Millar and Conine will get more time in the field than expected. Baseball Musings is conducting a pledge drive in March. Click here for details. Posted by StatsGuru at 06:24 PM
| Comments (1)
| TrackBack (0)
March 25, 2006
Defensive Analysis
Permalink It looks like The Fielding Bible is making it into a few front offices. And not all the players agree with the conclusions of the book. Here's Michael Young: Said Young: "I know I did my job well. I know myself, and I know how good I am and how good I can be. I know I'm not there yet. It's good to see people are paying attention to this type of research.
Posted by StatsGuru at 11:23 PM
| Comments (0)
| TrackBack (0)
March 16, 2006
Catching the Ball
Permalink The Royals understand their defense was horrible last year and are trying to take steps to correct that: And so on. Defense is the theme here at spring training. And defense cuts to the baseball heart for Buddy Bell. He was a great defensive third baseman, a six-time Gold Glove winner. He knows the Royals need their own identity. They�re not fast or particularly strong. They will not win games by outslugging teams or by blowing them away with nine innings of overpowering fastballs. I wonder how much the defense affected Zack Greinke? Maybe all those balls that should be outs just drove him over the edge. A better defensive team might bring him back. Baseball Musings is conducting a pledge drive in March. Click here for details. Posted by StatsGuru at 08:43 AM
| Comments (0)
| TrackBack (0)
March 15, 2006
Patterson in Right
Permalink Roch Kubatko is blogging for the Baltimore Sun. He likes Corey Patterson's defense in right. Nice to see his blog also allows comments, and he seems to interact with the fans. Baseball Musings is conducting a pledge drive in March. Click here for details. Posted by StatsGuru at 02:33 PM
| Comments (0)
| TrackBack (0)
March 03, 2006
New Position
Permalink Javy Lopez had a good first game at first base: In addition to his alert play in the fourth inning, he hauled in a foul pop, fielded successive hard grounders in the third and scooped up a roller while the top half of a broken bat was heading in his direction. He finished with 10 putouts, two assists and no errors.
Posted by StatsGuru at 09:28 AM
| Comments (3)
| TrackBack (0)
February 25, 2006
Soriano and Vidro
Permalink The Washington Post chronicles the two players in camp together: The theoretically awkward issue of Alfonso Soriano's presence in the Washington Nationals' spring training camp alongside veteran Jose Vidro, the Nationals' incumbent second baseman, became a practical one Friday. In the first full-squad workout of the spring, Vidro took grounders and performed drills with the rest of the starting infielders, while Soriano worked out with an infield group made up of mostly minor leaguers. Later, in the clubhouse, they sat three lockers apart, eating their lunches without interacting. One solution that no one talks about is moving Soriano to shortstop. Yes, he'll likely be the worst defensive shortstop in the league. The Nationals can live with that. Neither Guzman nor Clayton is any great shakes at short, how much worse can Soriano do? He'll hit a lot better than either of those two players. The other advantage is, if he's moved to short, it will be seen as a defensive promotion, while the move to left is clearly a defensive demotion. Soriano created 93 runs last year. Clayton created 55, Guzman 26. At worst, Soriano is going to be 10 runs worse that those two at shortstop. It's not a great solution, but it's one that probably improves the team overall. Posted by StatsGuru at 07:26 PM
| Comments (10)
| TrackBack (0)
February 21, 2006
Working on His Legs
Permalink Mike Cameron spent the winter conditioning himself for the big Padres ballpark: "(Going to right field) was definitely a big transition," he said. "I don't care what anybody says, it's not easy. But I learned something playing there." Maybe Cameron recognizes in this park his legs are a more valuable asset. Mike was also asked about other centerfielders: More than a great athlete, Cameron is an avid student of his position. Asked to name the best center fielder he has seen, he pondered the question before offering an unorthodox list that included Paul Blair, Devon White, Gary Pettis and Eric Davis. I don't quite see what's so unorthodox about that list. I'd probably include Andruw Jones, but all of those players could go get the ball. Posted by StatsGuru at 09:13 AM
| Comments (4)
| TrackBack (0)
February 19, 2006
Measuring Catchers
Permalink Alan Schwarz looks at the state of research in catcher's defense. According to his article, it seems that catchers don't make that much of a difference, at least in terms of ERA. Keith Woolner, the director of research for Baseball Prospectus, developed a more sophisticated Catcher E.R.A. several years ago to assuage those and other concerns. But he still found something remarkable: A catcher could indeed appear to have a major effect on his pitchers' E.R.A., but that effect often reversed itself the next year. Catcher E.R.A.'s bounced around as if at random. Although that doesn't prove the absence of true catching talent, it suggests that whatever exists does not manifest itself to a detectable degree. I'll need to look up Woolner's work on the subject. It strikes me that sample sizes in one season (especially for the backup) are responsible for the randomness. What's clear is that figuring out the catcher's contribution to ERA is a complicated, chaotic system. It has to do with the pitchers caught, the opponents, the overall defense that day. I'd be very wary of making this conclusion: Perhaps some teams are sensing this. Bengie Molina, considered a fine defensive catcher for the Angels, received little attention in the free-agent marketplace and signed for only a year with the Blue Jays. And Mike Piazza, who was thought to be retiring a glove many considered as useful as Michael Jackson's, was signed by the Padres � to be their starting catcher.
Posted by StatsGuru at 09:44 AM
| Comments (5)
| TrackBack (0)
February 18, 2006
The Catcher-Pitcher Relationship
Permalink Jorge Posada and Randy Johnson are working on improving their roles as battery mates. I'm not sure I understand what Randy means here, however: "I think it's important that you and the catcher communicate in between innings and know what is going well for you out there and what's not," Johnson said. "I think it's important that the catcher realizes that even if you think something is going well, and it really isn't, but you are convinced it is, that he still try to get you through the game. A lot of times in the first half (of last season) things weren't going well for me. I tried getting through it and it was a struggle at times." It sounds to me that Randy is looking for positive feed back, and maybe Jorge was offering negative comments last year. Saying negative things in a positive way is often tough to do, but it's a good skill to develop. Posted by StatsGuru at 11:05 AM
| Comments (1)
| TrackBack (0)
February 07, 2006
The Phill Curtain
Permalink Balls, Sticks and Stuff likes the way the Phillies defense is shaping up for 2006. Posted by StatsGuru at 09:10 AM
| Comments (0)
| TrackBack (0)
February 03, 2006
Defensive Comparisons
Permalink David Gassko pits the various Range ratings against UZR in two articles. One, published at The Hardball Times is an overview, while the one on Statistically Speaking does the math. Thanks to David for bringing all this information together! Posted by StatsGuru at 04:53 PM
| Comments (0)
| TrackBack (0)
Defensive Review
Permalink Jon Weisman of Dodger Thoughts pens a piece for Sports Illustrated on the latest in defensive statistics. A big thank-you to Jon for mentioning the Probabilistic Model of Range. Posted by StatsGuru at 01:19 PM
| Comments (1)
| TrackBack (0)
December 27, 2005
The Battle for Second
Permalink Jose Vidro joins Alfonso Soriano in not wanting to move from second base. Soriano has said he won't change positions, and Vidro said he won't either. Maybe the Nationals can think outside the box to satisfy both players. Instead of the shortstop moving for a shift on a left-handed batter, just bring in Soriano from left. The team doesn't expect a lefty to go the other way if there's a shift on, and this will give Alfonso a chance to play the infield, especially against Barry Bonds. Of course, the winner of a Celebrity Death Match works too. Posted by StatsGuru at 05:24 PM
| Comments (6)
| TrackBack (0)
November 30, 2005
What a Knucklehead
Permalink The Yankees are are saying Joe Torre was misquoted and they never had plans to move A-Rod or Jeter to centerfield: Cashman said he woke up yesterday morning and was "shocked" when he learned of the story. He said he immediately called Torre to ask about the quotes and was told by the manager that the story was "untrue." So Cashman does his best Capt. Renault, implying that the reporter is a stooge: The writer of the story, Larry Fine, said he taped the interview with Torre and had no doubts about the accuracy of his quotes. He said he believes he fairly represented Torre's statements and did not overstate the Yanks' interest in pursuing such a plan. So, Mr. Fine can settle this whole thing by posting the audio tape. It doesn't have to be ones word against another. Just post the tape on the internet. It's too bad the Yankees aren't seriously considering the move. I still think it's a good way to improve the team's defense. Posted by StatsGuru at 08:15 AM
| Comments (12)
| TrackBack (0)
November 29, 2005
It's About Time!
Permalink The Yankees are thinking about moving Jeter or A-Rod to centerfield: Torre said he has considered the merits of converting either shortstop Jeter or AL MVP Rodriguez, who has been playing third base since joining the Yankees, but has not raised the subject with either of his star players. They should have moved Jeter to center when they traded for A-Rod. So how about this? The Yankees move Jeter to center (he's the best fly chaser), A-Rod back to short and sign Bill Mueller to play third? Whoever DHs or Robinson Cano would be the least productive hitter in the lineup. Posted by StatsGuru at 09:12 AM
| Comments (16)
| TrackBack (0)
November 21, 2005
Fighting the Spectrum
Permalink Dave Collins is fighting the defensive spectrum in Colorado. Colorado Rockies coach Dave Collins was the man in charge when Matt Holliday made the conversion from a third baseman to a left fielder. He oversaw the move of Brad Hawpe from first base to right field. Moves from first to any other position are rare. Usually you play first base because you can't play at any other spot in the field. If Collins can take two first basemen and turn them into outfielders, that's quite an accomplishment. Posted by StatsGuru at 11:41 AM
| Comments (3)
| TrackBack (0)
October 07, 2005
Flaherty vs. Posada
Permalink John Flaherty gets the start tonight behind the plate instead of Jorge Posada. This breaks a streak of 67 post-season starts by Posada. Still, Flaherty has caught all but one of Johnson's last 22 starts, beginning when the Big Unit tossed seven shutout innings against St. Louis on June11. Johnson has gone 12-2 with a 3.29 ERA in games caught by Flaherty this season, and 5-6 with a 4.55 ERA while working with Posada. That includes a 10-2 loss to Detroit on July 1, the last time the Yanks' longtime catcher has called signals for the veteran ace. I had a discussion with a friend of mine about this the other day. He didn't see how you could start an offensive millstone like Flaherty in the playoffs. He also thought the sample sizes were too small to be able to discern an actual difference between the ability of the catchers to affect a pitcher. I disagree. If you believe the difference is caused by Flaherty, then he's saved the Yankees over 25 earned runs in around 21 games. Posada isn't that great a hitter that he's going to produce that much offense over 25 games. Posada created 71 runs in 142 games played, or 1/2 a run per game. For all intents and purposes, we'll give John a 0 for runs created. That means the Yankees are losing 1/2 a run offensively, but gaining over a run defensively with Flaherty behind the plate. That seems like the right trade off to me. It also explains why catchers are not known for their hitting. Catchers can have a huge defensive impact on the game, and that's often worth more than the best offense. I'd also like to note that this is nothing new. Torre often started Girardi in the post season in 1998 and 1999, even though Posada was clearly the superior offensive player. I trust Torre's recognition of defensive talent behind the plate, and he made the right moves in each case. Posted by StatsGuru at 08:14 AM
| Comments (10)
| TrackBack (0)
September 28, 2005
More Range Measurements
Permalink David Gassko at The Hardball Times has a new measure of range, BBARF. I have not had time to digest it yet, but there's a discussion going on at the Baseball Primer section of Baseball Think Factory. Posted by StatsGuru at 01:07 PM
| Comments (4)
| TrackBack (0)
September 20, 2005
Defensive Laspe
Permalink A rare bad play by Aaron Rowand leads to the Indians tying the game in the 9th. With one out and a man on first, Victor Martinez hit a fly ball to center that fooled the White Sox speedster. He started in on the ball, then raced back but the shot was over his head for a double. Belliard grounded out to tie the game, and the Indians have a man on third with two out for Broussard. Update: Jenks blows the save but not the game. The White Sox get a chance to win in the bottom of the inning, still tied at 6. Posted by StatsGuru at 11:02 PM
| Comments (3)
| TrackBack (0)
September 18, 2005
Giambi Shift
Permalink The Toronto Blue Jays are using the classic Giambi shift with a twist. Instead of moving everyone toward first base, the Blue Jays put the shortstop in short right between the first and second basemen. The announcers gave the reason for the manuver as shortstop Adams having more range than second baseman Menechino. Posted by StatsGuru at 02:01 PM
| Comments (0)
| TrackBack (0)
September 14, 2005
Strategy in the Ninth
Permalink I wish I had stayed up to see this double play: Sexson grounded into a double play, second baseman Kennedy to center fielder Izturis to first baseman Erstad, Ibanez out. Mike Scioscia did some defensive maneuvering in the bottom of the ninth, and it almost worked. The Mariners put men on first and third with no one out and Richie Sexson up. Mike replaced Steve Finley with Maicer Izturis and brought him in as a fifth infielder. It's a brilliant move as they not only hold the runner at third, but turn the double play. Scioscia then walks Beltre to pitch to the light hitting Greg Dobbs, who singles in the winning run to prevent the Angels from extending their lead over the Athletics. Sometimes you do everything right and it just doesn't work out. Posted by StatsGuru at 07:58 AM
| Comments (1)
| TrackBack (0)
September 12, 2005
Bonds Showing Range
Permalink Barry Bonds gets the first two putouts in the 3rd. He ran in on a liner hit straight at him, then ranged to center to take a ball Winn could have handled. It looks like he has not problem getting to balls, but he takes a few steps to stop. Posted by StatsGuru at 11:09 PM
| Comments (1)
| TrackBack (0)
September 02, 2005
Outfield Arms
Permalink Via Balls, Sticks and Stuff, ProTrade publishes a fascinating piece by Gabriel Desjardins on outfield throwing arms. He does something similar to my Probabilistic Model of Range to determine how many bases outfielders save with their arms. Great graphics and a nice use of probability models. Posted by StatsGuru at 05:50 PM
| Comments (1)
| TrackBack (0)
August 29, 2005
Turning Two
Permalink Staying with the theme of unusual Sox defense, the Red Sox hav turned four double plays through the sixth inning. They came into today dead last in the AL in double plays turned. I wonder how much having Olerud at first helps? One thing the Red Sox are doing much better is not grounding into double plays. They are 8th in the AL this season. When I was going to Fenway in the 1980s, it seemed the Sox were close to setting a record for GDPs every season. Posted by StatsGuru at 11:06 PM
| Comments (1)
| TrackBack (0)
Rare Errors
Permalink The Chicago White Sox used to be near the top of the AL in errors every year. Coming into today, they had the third fewest in the AL. That's why tonight's loss to the Rangers is so unusual. Tad Iguchi made three errors and Uribe added a fourth to let in three unearned runs as the White Sox lost to the Rangers 7-5. Without the unearned runs, they win the game. Posted by StatsGuru at 10:37 PM
| Comments (1)
| TrackBack (0)
August 26, 2005
Nomar at Third
Permalink The Marlins are not the only team usings a new third baseman in this game. Nomar gets a start at third and makes a throwing error on a bunt by Juan Pierre. With Vargas at first (he's batting .313), Pierre bunted (looks to me as if he were going for a base hit). The shortstop, Cedeno, went the wrong way, breaking for third. The second baseman, Perez, went to cover first. Nomar was going to throw to second to get the runner (the ball was bunted firmly) but no one was there! Nomar then slung the ball in the direction of first base, to the outfield side of Derrek Lee. Nomar got the error, but Cedeno made the bad play. Update: The official scorer called it a Sacrifice and Error. I thought he was bunting for a hit, but the defense treated it like a sac. Update: Vargas gets his 2nd hit of the game, making him six for seventeen on the season with two doubles. Posted by StatsGuru at 02:53 PM
| Comments (3)
| TrackBack (0)
August 21, 2005
Bad Defense, Good Defense
Permalink Tony Graffanino just made what could be a game-saving catch for the Red Sox. The Sox lead 5-1 in the 9th, and Curt Schilling is in for his last relief appearance before he starts. With men on 2nd and 3rd, a fly is hit to no-man's land in right center. Graffanino ran back, fighting the sun, put his glove up, and the ball hit the heel. It rolled down his arm and Tony snatched it out of the air. Schilling gets a fly to center to finish the game and give the Red Sox the victory. Posted by StatsGuru at 07:09 PM
| Comments (2)
| TrackBack (0)
August 18, 2005
Defensive Tango
Permalink Tangotiger is once again calling for the baseball community to contribute to the 2005 Scouting Report. What I would like to do now is tap that pool of talent. I want you to tell me what your eyes see. I want you to tell me how good or bad a fielder is. Go down, and start selecting the team(s) that you watch all the time. For any player that you've seen play in at least 10 games in 2005, I want you to judge his performance in 7 specific fielding categories. I love this idea, using the great baseball knowledge of the public to turn subjective judgements into objective data. I hope everyone will participate. Posted by StatsGuru at 10:36 PM
| Comments (1)
| TrackBack (0)
August 11, 2005
Get the Sure Out
Permalink The Royals just made a serious defensive blunder. D.J. Carrasco was pitching a great game, shutting out the Indians through six innings. But the Indians got the first two runners on in the 7th. Ronnie Belliard bunted to move the runners, and Carrasco threw to third on the signal by his catcher. The throw was late, and the Indians loaded the bases. When you're having a tough time winning, every out is precious. Jeff Liefer made Carrasco pay for the error, taking the next pitch over the right field fence for a grand slam. They Royals find themselves down 4-2 in the the 7th, and are now looking at their 13th loss in a row. Update: The Indians make the 4-2 score hold up, and the Royals extend their losing streak to 13. The Indians pull within 2 1/2 games of the Angels in the wild card race. Posted by StatsGuru at 10:03 PM
| Comments (5)
| TrackBack (0)
Hidden Gem
Permalink Here's an account of Mike Lowell pulling the hidden ball trick. A list of these deceptive plays can be found at retrosheet.org. Posted by StatsGuru at 08:35 AM
| Comments (3)
| TrackBack (0)
August 09, 2005
Washington Defense
Permalink The Nationals defense makes the game with the Astros close. With the bases loade and two outs, Cristian Guzman throws a groundout away, leading to two runs. Washington leads 6-5 in the seventh. Posted by StatsGuru at 10:11 PM
| Comments (0)
| TrackBack (0)
July 07, 2005
Playing Catch
Permalink The Mets take a 3-2 lead in the top of the 11th on a very interesting play. With Beltran on second and Floyd on first, one out, Piazza singles to right. Guillen throws home trying to get Beltran, but the throw is not in time. Piazza tries to advance, and the catcher Schneider guns Piazza out at second. Floyd then tries to score from third, and Carroll guns him out at the plate. A 9-2-6-2 double play. Update: Looper gets the save as the Mets win the game 3-2. Posted by StatsGuru at 04:25 PM
| Comments (1)
| TrackBack (0)
June 29, 2005
Embarassing Play
Permalink The Cincinnati Reds played embarassing defense in the 2nd inning against the Cardinals tonight. It seemed every time they touched the ball something went wrong. Jason Romano is playing center field. Reggie Sanders hit a ball to the warning track in center, and instead of getting under it, Romano tried to reach out from the side. He was totally fooled, and the ball bounced into the stands for a ground rule double. It's one of those hits that the rules don't call an error, but it really was poor defense. Later in the inning, Felipe Lopez throws two balls away. Neither looked like a difficult play. The big difference I see between major league and minor league games is the fielding. Tonight, the Reds are fielding like minor leaguers. Posted by StatsGuru at 09:08 PM
| Comments (1)
| TrackBack (0)
June 27, 2005
Weak Arm Juan
Permalink Rafael Furcal just scored on a fly ball that any would have stopped most runners from even trying to tag up. Juan Pierre fielded the ball in shallow center field, about as shallow as you can go and still be in center field. He was behind the ball, had his momentum going toward the plate, but released a lollipop throw, and with Furcal's speed it wasn't even close. Juan should be embarassed about that play. Posted by StatsGuru at 07:12 PM
| Comments (5)
| TrackBack (0)
June 26, 2005
Yankees Mistakes
Permalink With two out in the 7th scored tied 1-1, the Yankees showed one of their great weaknesses, defense. Womack is playing center tonight and Chris Woodward hit a ball over his head that a good CF would have caught. It went for a double. A walk and a wild pitch put runners on 1st and 3rd. An error by the 2nd baseman Cano gave the Mets the lead. An infield hit and an error by Giambi allowed two more to score, and the Yankees are down 4-1 instead of being even with the Mets. Posted by StatsGuru at 10:28 PM
| Comments (2)
| TrackBack (0)
June 20, 2005
Darth Diamondback
Permalink Jose Cruz Jr. is in the dog house in the club house due to his poor defense. After a tough day in the outfield, when he misjudged and misplayed a few fly balls hit his way during Arizona's 3-2 loss to the Cleveland Indians at Jacobs Field, Cruz found an image of Darth Vader taped above his locker. Yes, Jose's misplays led to runs that cost the Diamondbacks the game. But he also hit a home run. Where was the rest of the Diamondbacks offense? They weren't exactly storm troopers out there yesterday. That's two days in a row where the opposition scored three runs and the DBacks lost. There is plenty of blame to go around. Posted by StatsGuru at 08:30 AM
| Comments (1)
| TrackBack (0)
June 09, 2005
Little Web Gem
Permalink Mom and coach Tracy Cooper sends this story about a great play made by her young son: As I sat in the dugout waiting for our team to reach the final out of the inning, I kept thinking to myself, would I rather be in the stands cheering with the rest of the mothers and taking snapshots of memories or is this pressure really worth the results. The batter finally swings and it was like everything went into slow motion as the ball shot straight up in to the air. Now, I shouldn't be taking all this so seriously. These kids are only playing T-Ball and yet they are hitting off of the coaches pitches; rather fast I might add, because after all dads do take this game seriously. Some of them just completed kindergarten, like the catcher for example. I watched him raise up with strength and reach for his catchers mask with his right arm. I, and the other coaches stood up in our seats as well, pretending to mimic the catchers motions, as we knew what we wanted him to do, catch the ball. As he threw his mask to the ground, he looked straight up into the clouds and kept his eye on the ball never looking at the batter, never turning to the crowd and searching for mom or dad to see if they were watching. Oh, I was watching and I was praying and I was clinching my fists with anticipation. As the ball was dropping, ever so slowly, I saw the catcher kick his feet back up into the air and stretch his arm to the top point of home plate where he dove and met the ball with his glove. It was picture perfect. An instant snapshot that took forever to complete and yet I will remember it forever. Then I see this catcher, after the dust settled away, realizing that he had caught the ball. With the biggest smile he jumped up into the air shaking his glove with the ball still intact inside to share his excitement with the team and crowd. The coaches and parents began jumping up for joy and waving their arms in the air sharing this elated moment with the rest of the team. Later that night, at home, while watching Baseball tonight on ESPN, my son looked over at me and said "Hey mom... Do you think my catch today at home plate was good enough to make it into the top ten web gem hall of fame?" Makes me wish I would've had my video camera. Posted by StatsGuru at 01:46 PM
| Comments (1)
| TrackBack (0)
May 31, 2005
Good Start
Permalink David DeJesus starts off Buddy Bell's tenure by stealing an extra-base hit from Derek Jeter. Jeter hit a ball to the wall in deep left center, but DeJesus ran it down. Posted by StatsGuru at 08:10 PM
| Comments (0)
| TrackBack (0)
May 27, 2005
Texas Defense
Permalink An interesting article in the Dallas Morning News on the Rangers defense. Hank Blalock's 53 game errorless streak ended Thursday, and the article concentrates on how flawless the Rangers are playing. So, if the question is about him, Blalock can quickly turn the subject to how Mark Teixeira has played flawlessly at first base this season. Or how catcher Rod Barajas has thrown out almost everybody who has tried to steal. Or maybe he can interest you in a little talk about the outfield's infallibility. Or even the pitchers holding runners and fielding their position well. Showalter understands that defense is about more than errors. Showalter agreed when the supposition was tossed in front of him that team defense has been the Rangers' most consistent asset this season. With all this praise for the Texas Rangers defense, their ability to turn a batted ball into an out must be called into question. The Hardball Times graphs fielding independent pitching vs. defensive efficiency, and according to that, Texas' defensive strength is the staff, not the fielders. There is, however, one thing that leads me to believe that the chart may not be accurate. If you scroll down to the pitching table, you'll see that the Rangers pitcher's have allowed a high percentage of line drives. Since line drives often turn into hits, the defense may be better than the DER is telling us. When I get the data for the Probabilistic Model of Range, the Rangers will be the first team examined. Posted by StatsGuru at 11:18 AM
| Comments (4)
| TrackBack (0)
May 21, 2005
Cruz Control
Permalink I have not seen the highlights, but Bob McManaman describes a catch by Jose Cruz, Jr. last night that can only be described as lucky. It reminds me of Lou Piniella sticking out his glove in the 1978 playoff game against the Red Sox to stop a hit from going for extra bases. Posted by StatsGuru at 10:58 AM
| Comments (2)
| TrackBack (0)
May 20, 2005
Mientkiewicz Mistake
Permalink There was an unusual play in the Yankees-Mets game. In the 9th, with Womack on first, Sheffield hit a ball into the hole that ticked off Wright's glove and into Reyes mitt. Reyes made a strong throw, but it was too late to get Sheffield. Mientkiewicz, when he made the catch, turned to look at the umpire to see what the call was. While he's turning his head, Womack scooted to third, since Wright was out of position. It looked to me that if Mientkiewicz had come up throwing, it's possible he could have caught Womack at third. I was amazed that he bothered to look at the ump rather than paying attention to the runner. Posted by StatsGuru at 10:28 PM
| Comments (1)
| TrackBack (0)
May 18, 2005
Foot on the Bag
Permalink A real strange play in the bottom of the first of the Cleveland-LAAOA game. With Sizemore on 1st, Victor Martinez hit a grounder to Erstad at first. Erstad bobbled the ball with his foot on the bag. As he reached for it, the umpire saw Erstad's foot come off the bag. Erstad picked up the ball and threw to second, thinking he had the force at first. The shortstop Cabrera took the throw, but his tag of Sizemore was late. Scioscia came out to argue the play at first. The replay showed the play at first was very close; it wasn't clear to me that Erstad's foot came off the bag. The umpires confered, and decided that they would not overrule the call. However, given that the batter wasn't forced, they then called Sizemore out at 2nd, saying he was forced. However, the replays make it look like Cabrera's foot wasn't on the bag, however, the replay angles were not good. So the Angels ended up getting an out, and Colon got out of the inning. Posted by StatsGuru at 12:23 PM
| Comments (0)
| TrackBack (0)
April 30, 2005
Air Byrnes
Permalink A fine defensive play by Eric Byrnes to end the top of the 5th. The ball was hit in foul territory near the third base bullpen. Byrnes lept horizontally, got good air time, and made the catch parallel to the ground. Quite impressive, but he looks like he hurt his face on the landing. Posted by StatsGuru at 05:59 PM
| Comments (2)
| TrackBack (0)
April 27, 2005
Bail Outs
Permalink The Oakland Athletics defense did a good job of bailing out Kirk Saarloos today. Saarloos walked 5 today, but four double plays by the Oakland infield helped erase most of those runners. Street induced the last of those DPs when he entered in relief. Freddy Garcia has also just allowed 1 run so far. He's doing it the old fashioned way, having only allowed four hits and two walks through 7 innings. Posted by StatsGuru at 05:25 PM
| Comments (2)
| TrackBack (0)
April 26, 2005
Wiping Out Runners
Permalink Mark Buehrle is getting some defensive help tonight. The White Sox have turned a double play in each of the first three innings. Harden has allowed 1 run, which is probably enough for him to lose tonight. :-) Update: The Oakland Athletics scoreless innings streak ends at 26. Kotsay drove in Ginter to make the score 3-1 White Sox in the bottom of the fifth. Posted by StatsGuru at 10:50 PM
| Comments (5)
| TrackBack (0)
April 25, 2005
Unusual DP
Permalink If you have a chance, catch the double play in the top of the first of the Braves-Mets game. With men on first and third, one out, LaRoche grounded back to the pitcher. The ball hit Heilman in the leg and bounded over to the third baseman. Wright didn't have a chance to get the runner at the plate, so he threw to first to get LaRoche. Wright, however, left third base open, so Jordan (who had moved to 2nd) took off for third. Reyes ran with him, and Woodward threw a perfect strike to a moving Reyes so to get the tag play on Jordan. Appropriately, it looked like a football play. Posted by StatsGuru at 07:59 PM
| Comments (1)
| TrackBack (0)
April 24, 2005
A for D
Permalink The Athletics can't hit their way out of a bag this season, but they're backing up their pitchers with great defense. I've seen two fantastic catches in the outfield tonight and good work by the infielders on double plays. The game is scoreless after six innings. Update: Steve Finley puts one where no defener can get it, giving the Angels a 1-0 lead in the 7th. Blanton has now given up three home runs, all solo shots. Posted by StatsGuru at 09:39 PM
| Comments (0)
| TrackBack (0)
April 21, 2005
At Least He Can Field?
Permalink If you are going to hit .140 as a shortstop, you better be the best defensive player at your position. Guzman was not today. He made an error that allowed two runs to score in the 9th inning, handing the Braves an unearned victory. It was the worst possible time to boot a ball. Maybe the Nationals will get lucky like the Cubs have have Cristian injure his groin. Upate: I'm told it wasn't a booted ball, it was a throwing error. Still, the post holds. He should be making an error in that situation. I just watched the play on Tivo. He did a good job getting to the ball in the hole on a very wet infield. He rushed his throw, however. It would have been a very close play if he had taken his time and set himself, but even if he didn't get the batter, it would have been a tie game at that point. Also, Nick Johnson tried to hold the bag and reach for the ball. If he had come off the bag, he might have stopped the throw from going by and saved a run. Posted by StatsGuru at 05:25 PM
| Comments (5)
| TrackBack (0)
April 17, 2005
Non Catch
Permalink I just saw an unusual play by Steve Finley. Nick Swisher hit a ball deep in the right-center power alley. Finley ran for the ball, and ended up over running it as he was near the wall and the ball fell behind him. He seemed to have a tough time tracking the ball, but it was a play he should have made. He had plenty of time to get there. Posted by StatsGuru at 05:03 PM
| Comments (1)
| TrackBack (0)
April 16, 2005
Missing Varitek
Permalink Pedro Martinez threw three wild pitches today, and the three were directly responsible for his two runs allowed. As I listened to the game on the radio driving around this afternoon, I wondered how much having Piazza behind the plate caused them. The third one was off Piazza's body, and from the play by play description it seems a better catcher would have had it. Watching the first two on Tivo, Piazza never tries to get his body in front of the ball. He's set up outside, and when the pitch comes low and inside, all Mike does is try to backhand the ball with his glove. There's no attempt to move to block the pitch. If this keeps up, Pedro won't have any confidence throwing pitches in the dirt. Lots of batters will swing at those, but you need the catcher to stop the ball to record the out. Posted by StatsGuru at 07:53 PM
| Comments (3)
| TrackBack (0)
April 07, 2005
Entering the Main Stream
Permalink SI.com links to Derek Jeter's fielding chart! Thanks to Jacob Luft for the link. Posted by StatsGuru at 12:57 PM
| Comments (2)
| TrackBack (0)
April 05, 2005
Oops.
Permalink With men on second and third and two outs, Lowe gets the grounder to Valentin. Jose boots the ball and throws late and wide to first for the error. Alou gets the RBI to give the Giants the lead and put Schmidt in line for the win. I'm sure DePodesta will take a beating over that error. It should have been an easy out. Posted by StatsGuru at 06:15 PM
| Comments (1)
| TrackBack (0)
April 03, 2005
Giambi Saves Jeter
Permalink I was just going to note that Jeter hasn't had a difficult play tonight, when he nearly throws the ball away on a slow grounder. Giambi make a nice stretch to left, falls over, but catches the ball and holds the bag for the out. Yankees lead 4-1 in the middle of the 5th. Posted by StatsGuru at 09:42 PM
| Comments (0)
| TrackBack (0)
So Much for the Defense
Permalink Giambi makes the first error of the season. He dove for a instead of getting in front of it. But Renteria grounds into a double play to negate the miscue. Posted by StatsGuru at 08:52 PM
| Comments (0)
| TrackBack (0)
Gold Star Play
Permalink Kevin Millar gives the ball a ride, but Hideki Matsui makes the first great play of 2005, bring the ball back into the park in front of the Canon sign in left field. It's 0-0 instead of 2-0. Posted by StatsGuru at 08:31 PM
| Comments (0)
| TrackBack (0)
March 28, 2005
Team Charts
Permalink With the introduction of a graphical representation of the Probabilistic Model of Range for players, I've had a couple of requests for entire infields, specifically the Angels and the Yankees. I'm presenting the charts for groundballs in two ways:
Note that I don't break it out by individual players; it's all shortstops for a team or all third basemen for a team. Without further ado, here are the charts for the Angels and Yankees. (Click on graph for a clearer view.)
One example of how to use these charts is to look at the hole between third and short for the Angels, vector 1. The Angels as a whole are above average here, but it's due to the third basemen being way above average, while the shortstops as a whole are below average. The other thing these graphs are telling me is that I don't have park effects right. The expected curves for the two teams mostly look as they should; They have four humps representing the straight-away position of the fielders, the places where you would expect the most outs. But the Angels have a big hump down the right field line; the Yankees have a smaller hump up the middle. There's no reason for me to believe that a ground ball down the line is easier to field in Anaheim than anywhere else in the majors. Even though the data is smoothed (1/2 without park effects, 1/2 with) it's obviously not enough. I'll be persuing other ways of dealing with park effects in the near future. Baseball Musings is holding a pledge drive during March. Click here for details. Posted by StatsGuru at 03:14 PM
| Comments (5)
| TrackBack (0)
March 27, 2005
Catching School
Permalink Tyler Kepner pens an excellent article on Jorge Posada's interactions with his pitching staff. It's a constant learning experience for Posada: "My favorite part is knowing that they're comfortable, knowing that, no matter what, they can count on me," Posada said. "What I really enjoy most about catching is the relationship with a pitcher. The most important thing is they can relax when I'm back there and know that I did my job, I did some homework on hitters." He has to adjust to each personality on the mound: The hard part, Posada said, is that every pitcher is different. Roger Clemens wanted constant feedback. Orlando Hern�ndez needed Posada to challenge him. Mike Mussina directs his own game, with little interference. Posada adjusts daily, depending on the pitcher. And the pitchers depend on him for clues to how to work the batters: Pavano peppers his catcher with questions between innings, asking if he saw the same thing Pavano did from a hitter. Wright, who said he was easy to catch because he throws mostly fastballs, also relies on the catcher to read a batter's clues. The piece does a nice job of illustrating a subtlety of the game that's difficult to quantify. It also shows why there's more to a catcher's defense than throwing out base stealers.
Posted by StatsGuru at 09:50 AM
| Comments (3)
| TrackBack (0)
March 26, 2005
Defensive Charts
Permalink The Easter Bunny arrived a day early for me, and instead of colorful eggs I received colorful charts representing each fielder's probabilistic model of range. For each player, there's a se of graphs with a black line for actual outs, a yellow line for predicted out, a red line for the difference between the two, and blue lines representing the best and worst values for those data points by qualifying players. I want to thank and congratulate Dave Stasiuk for his hard work and excellent programming skills in creating these web pages. Thanks to to Studes for many mock ups and helpful suggestions. I'm having a great time looking at these graphs, and I hope you do also.
Please feel free to use the comments to suggest any improvements. Update (7:00 AM EST March 27, 2005): David Stasiuk explains the blue lines: It's +/- 1 standard deviation from the average AO/BIP for each vector by position by BIP type, as weighted by the number of balls in play for each player...so, for example, a shortstop who played one game, and had one ball hit to him and made it for 1.0 AO/BIP would only have one record at 1.0 in calculating the standard deviation, whereas a shortstop who played every game and had 0.93 AO/BIP in 200 BIP to the same vector over the course of the season would have 200 records at 0.93 in calculating the standard deviation. Baseball Musings is holding a pledge drive during March. Click here for details. Posted by StatsGuru at 09:56 PM
| Comments (14)
| TrackBack (1)
March 18, 2005
Middle Men
Permalink The Detroit Tigers Weblog uses our Range Charts to look at the possible replacements for Alex Sanchez. We should have range charts for all players soon.
Posted by StatsGuru at 09:16 AM
| Comments (1)
| TrackBack (0)
March 14, 2005
Defensive Confusion
Permalink I want to clear up a misconception that about my thoughts on defense that's running through this Sons of Sam Horn thread. Unfortunately, I can't respond there because I'm not a member. In an interview with Red Sox nation, I wrote: Johnny Damon was hands down the best outfielder in the AL last year, but keep your eye on Mark Kotsay. On the SoSH thread, I see this (typo corrected): As noted in the other Pinto thread, the charts seem to contradict a) his comments in the RSN interview and b)conventional wisdom about many things including Beltran & Damon as defensive studs My comments on Damon were based on his defensive win shares. Defensive win shares take into account a number of different elements of defense, including outfielder's arms. PMR is only concerned with turning batted balls into outs. Secondly, my system is still in development. I'm not convinced I have the correct weighting of parameters yet, especially when win shares says one thing and PMR disagrees on a major aspect of the calculation. What's clear is the Damon got to more balls than any other AL center fielder. My calculations say he should have gotten to even more, but given that Bill James spent years on the problem and I've spent a couple of months, I'm willing to give win shares the edge when rating the overall defense of a player.
Posted by StatsGuru at 10:56 AM
| Comments (14)
| TrackBack (0)
March 10, 2005
Put Me in Coach
Permalink I thought another interesting study using the charts for the Probabilistic Model of Range would be to look at Mike Cameron and Carlos Beltran as centerfielders. First, let's look at their overall 2004 performance catching fly balls. Here's Cameron (click on graphs for a larger view):
And here's Beltran:
They look very similar. Cameron has a dip at the top of the curve which I'll come back to. Since these graphs don't tell us much, I though it would be interesting to break them down by batted ball velocity as well. Baseball Info Solutions records three types of velocity -- soft, medium and hard. Let's start with the medium fly balls.
These should be the routine plays. Cameron looks a hair better, but both do a good job of catching what they should catch. Let's move to the hard hit balls, the ones that should be over their heads:
There's a lot of noise in Cameron's data, but Beltran looks like he does well on balls hit deep. Finally, let's look at soft fly balls:
Back to Cameron's dip. Cameron doesn't do as well with balls hit to straight away center as one might expect, especially on soft fly balls. Cameron's tracks flys very differently from most outfielders. I wonder if this causes him to have trouble with balls hit right at him? Does he jump back, then fail to come in? I'd love to hear from Mets fans about this. Update: There's an excellent post in the comments on the physics of a ball hit directly at a center fielder.
Posted by StatsGuru at 12:11 PM
| Comments (6)
| TrackBack (0)
March 09, 2005
Charting Guzman
Permalink The response to the David Eckstein range charts has been overwhelmingly good. I thought I'd also put up charts of Cristian Guzman, since he did very well in the study. Here's Guzman on ground balls. He fits the prediction almost exactly (click on charts for a large image).
Here's Cristian on fly balls:
He really shines on line drives, however.
Some commentors have pointed out that Eckstein is short for a ball player. I see him listed as 68 inches. Guzman is listed at 72 inches, so that may make a difference. However, I took at look at the relationship of height to PMR on line drives, and didn't find anything indicating that it really mattered.
Posted by StatsGuru at 05:06 PM
| Comments (3)
| TrackBack (0)
Charting Range
Permalink Over the last few days I've been chatting with Robert Saunders about presenting data graphically. He pointed me to this post on Edward Tufte's web site, where's he trying to present charts that are the size of words. I'm not there yet, but Robert did get me thinking about presenting the Probabilistic Model of Range graphically. I thought I'd give it a try with David Eckstein, since there were some arguments over whether the data properly reflected his abilities. What I've done is broken the data down by ball in play type (grounders, flys and liners). Each chart below has the direction of the ball on the X-Axis. The Y-Axis represents the probability of turning those balls into outs. Eckstein's actual probability is compared to the predicted probability. For reference, a vector of -4 (minus 4) represents the thirdbase line, and 8 represents straight away centerfield. Here's Eckstein on grounders in 2004 (click on graphs for a larger image):
As you can see, David is great when the ball is hit right at straight away short. But once he starts moving left or right, he becomes a below average fielder. Nothing terrible, just below average. Now let's look at fly balls.
I really love the information this chart conveys. It shows that fly balls are usually caught by shortstops around the normal position, they go down around third base, but pick up again in foul territory. And this shows why David does so poorly. He does not catch pop ups in foul territory. With the Cardinals, he has a great fielding third baseman in Rolen, so Scott will have to go after balls the shortstop usually gets. Finally, the line drive chart.
He's just way below average to his left. Even at balls hit right at the position, he doesn't do well. Does he not react quickly? I'll be doing a few more of these. I hope you find them as informative as I do. Update: Fixed a left-right problem. I said that Eck was below average to his right. I meant left. Thanks, Studes.
Posted by StatsGuru at 11:40 AM
| Comments (33)
| TrackBack (4)
March 06, 2005
Yes I Can, No You Kent
Permalink Dodger Thoughts points out an article where the reporter gets two different versions of how to measure defense from Jeff Kent (can't be done) and Paul DePodesta (who's still working on it). I get the feeling Kent doesn't like trying to measure defense because he doesn't do well.
Posted by StatsGuru at 09:52 AM
| Comments (0)
| TrackBack (0)
March 01, 2005
Probabilistic Model of Range, Smoothed Shortstops
Permalink Earlier in the year I presented a Probabilistic Model of Range. One problem I had with the way I was calculating the numbers had to do with park effects. By including park as one of the six parameters, I made the sample size of each combination very small. I also made the data very dependent on the regular fielder for the home team. One way of fixing this problem is through smoothing. I'm now looking at two probabilistic models; one using six parameters including park, and the other using five parameters excluding park. I then take a weighted average of the two models to come up with the smoothed model. In this case, I'm using equal weights (I'm more than happy to entertain arguments for other weights). Because samples sizes based on parks are small, the probabilities calculated are going to have a high variance. By averaging in the model based on the entire major leagues, we're reducing that variance. Here's the list of shortstops, based on the new model (original here):
At first look, the two lists rank about the same. I did notice, however, that two players moved up quite a bit; Barry Larkin and Miguel Tegada. I curious to know which list matches your expectations better. Baseball Musings is holding a pledge drive during March. Click here for details. Posted by StatsGuru at 08:18 PM
| Comments (4)
| TrackBack (0)
February 28, 2005
Right-Center
Permalink J.D. Drew and Milton Bradley have worked out their outfield assignments for the Dodgers. "He was telling me he's not trying to step on any toes," Bradley told the Los Angeles Times. "We are in agreement that we want what's best for the team. We want everybody to fulfill his potential. A good compromise. I don't quite understand, however, why playing center field would be less taxing on Drew's knee than playing right. I would think that in right field you would be involved in many fewer plays. Does anyone understand the different pressure on the knee in right? Posted by StatsGuru at 12:43 PM
| Comments (6)
| TrackBack (0)
February 26, 2005
Oldest Outfield
Permalink Ira Berkow of the NY Times notes that the Giants will have the oldest starting outfield ever. And how do the pitchers feel with an outfield for the ages? Looking for the silver lining, that's how. Lots of strikeouts would help, too. Posted by StatsGuru at 08:55 AM
| Comments (3)
| TrackBack (0)
February 16, 2005
Defensive Regression Analysis
Permalink I'm sorry I haven't linked to this sooner. Michael Humphreys Defenisve Regression Analysis has been published as a single article at The Harball Times. It's well worth the read. Posted by StatsGuru at 08:54 PM
| Comments (2)
| TrackBack (0)
February 15, 2005
Saving Games
Permalink Sometimes I wonder how people get to be general managers of clubs: Minaya figures first base is undervalued in the market place and in the minds of the average fan. "People take the position for granted," he said. He looks at a guy like J.T. Snow of the Giants, a smooth, graceful glove who "saves the Giants 10 games a year," and he anticipates something similar for his club with Mientkiewicz. When I hear something like that, my first reaction is that first basemen are just not that involved defensively that they could save the number of runs needed to make a ten game difference. To do that, a first sacker would need to save 100 runs. That's a lot of doubles stopped from going down the line, and a lot of possible throwing errors scooped. Given that Helton earned 4.1 win shares with his glove (the best in the NL in 2004), and that equals about 1.4 wins, first basemen can't do that just with the glove. However, it's possible that Omar isn't talking about overall performace, but actual clutch fielding performance. In other words, Omar is saying that Snow makes 10 plays a year that prevent wins from becoming losses. Is that possible? Do first basemen get enough balls hit to them in game situations that they can save 10 games? Do they catch enough errant throws in those situations to save 10 games? Can this actually be measured? I decided to see if the Probabilistic Model of Range (PMR) can help. I envisioned a clutch situation where the first baseman turning a ball into an out might make a difference.
So, how did firstbasemen do in this siutation? The person with the most tough balls in play against him was Lyle Overbay with 14. His expected outs on those balls was 2.05. He turned 2 of them into outs. Nice work, Lyle! Jim Thome did very well. He had 7 tough balls put into play against him in those situations and turned three into outs, as did Shea Hillenbrand. Thome's were tougher to handle, however, as we expected only 0.93 outs for Jim, 1.55 for Shea. What about Snow? He had 5 such tough balls in play, and turned none of them into outs (expected 0.64). And Doug Mientkiewicz? Like Snow, he had 5 in play, 0 outs (expected 0.93). Yes, maybe they turned 10 bad throws into outs in those situations. Maybe not. But no one is coming close to turning really tough plays into outs at the rate of ten games a year, and few are even getting the opportunity. Posted by StatsGuru at 09:32 AM
| Comments (15)
| TrackBack (0)
February 10, 2005
Probabilistic Model of Range, Catchers
Permalink Although range is probably the least important aspect of a catcher's job, we can measure it with this system as well. So for the sake of completeness, here's the rankings for catchers.
The main problem using this data to seriously measure catchers is the foul pop data. Foul balls that are not caught and not errors are not recorded. So the probability of catching a foul pop is bascially the probability of not making an error on the play. Posted by StatsGuru at 12:19 PM
| Comments (8)
| TrackBack (0)
February 09, 2005
Probabilistic Model of Range, Pitchers
Permalink Not too many people have tried to measure the range of pitchers. One nice thing about this model is that it builds in the handedness of the pitcher. So the model should automatically account for the fact that righties fall off the mound in one direction and lefties in the other. Since pitchers are not in the field as much as other position players, I've lowered the minimum to 500 balls in play.
Other than Greg Maddux having won many gold gloves, I don't know enough about the fielding reputation of pitchers to know if these numbers look good. If there are any experts in the field, please let me know. Obviously, fielding ability should not weigh very much in evaluating a pitcher. Still, it's nice to see who is a cat around the mound. Posted by StatsGuru at 01:58 PM
| Comments (5)
| TrackBack (0)
Probabilistic Model of Range, Leftfielders
Permalink Without further ado, the range rankings for leftfielders.
Our eyes often deceive us when it comes to defense, but not in the case of Ryan Klesko. He's just as brutal as he looks. It's also interesting to note that some of the older players (Bonds, Alou, Luis Gonzalez) are right where they should be, getting the balls at the expected rate. Sig Mejdal wrote the injury prediction section of The Bill James Handbook 2005 and one thing he's looking at is how aging and experience effect skills in the game. For example, he's found that the physical process of aging hurts HR production, but experience helps HR production. I'm wondering if that is going on here; these left fielders have so much experience in the outfield that they can make up for their old legs with positioning. Posted by StatsGuru at 10:17 AM
| Comments (8)
| TrackBack (0)
February 08, 2005
M vs. M
Permalink In the previous post, I noticed a big difference in range between Doug Mientkiewicz and Kevin Millar at first base. Millar did much better, which was a surprise. The first thing I wanted to see was the difference in batted ball types. If the difference is in pop-ups, that might be the answer right there. (Remember, this is full year data, not just with the Red Sox.)
It's not popups. Kevin is outperforming Doug on grounders and line drives. Now, Millar is getting a big boost from the liners; that can be great positioning or pure luck. But he's also doing very well on the grounders. Let's break the grounders down by direction for both fielders.
It looks like Millar is doing a better job than Mientkiewicz at fielding balls hit right at the normal first base position. I'm stumped for an explanation. Maybe the Red Sox make such good use of batted ball data that they positioned Kevin perfectly. Maybe, for some reason, the model does not value the balls hit at Millar as highly as the balls hit at Mientkiewicz. If either were true, then moving Doug to the Red Sox should have helped his range. In fact, it did. With the Red Sox, Mientkiewicz recorded 73 outs on 62.44 expected outs, a DER difference of 0.01278, a big improvement in his overall number of 0.00248. Given that the Red Sox are very carefully studying ball in play data, I bet the positioning has a lot to do with it. Posted by StatsGuru at 10:42 AM
| Comments (11)
| TrackBack (1)
Probabilistic Model of Range, First Basemen
Permalink I would normally run left fielders here, being the next position in the defensive spectrum, but I've fallen behind and have a request for first basemen.
I'm not surprised that a good centerfielder also fields well at first base, although my gut feeling is the Angels needed his glove in center more than at first. Other converts didn't work out so well as Green and Piazza finished at the bottom of the list. Green also did poorly when he was in right field. If you're going to have poor range, better at first than in right. A big surprise on the list will be the relative positions of Kevin Millar and Doug Mientkiewicz. It's worth breaking those two down further. I'll do that in the next post. Posted by StatsGuru at 10:14 AM
| Comments (6)
| TrackBack (1)
Run Estimation, II
Permalink I'm feeling better today and was able to think through the problem a little more clearly. Thanks for all the comments on the last post. I did a simple calculation using the latest Bill James runs created formula for teams, found in The Bill James Handbook 2005. I first imagined a team that had 6000 plate appearances and got 1500 singles as a result (no walks, extra-base hits, etc). The RC formula would estimate that the team would score 422 runs. I then added 44 singles, giving the new team 6044 plate appearances. The run estimate for this team was 444 runs, or 22 more. So estimates from 18 to 30 do appear to be in the correct range. I would offer one caveat, however. Because Eckstein is getting 44 fewer outs doesn't mean those outs aren't being picked up by other fielders. Some have pointed out that there is noise in the popup data; pretty much every popup is caught by a fielder. There is noise in the groundball data as well. There are going to grounders where both the third baseman and the shortstop have non-zero probabilities of fielding the ball. If the third baseman, due to superior range, cuts in front of the shortstop often he'll take outs away from the middleman. In most cases these should even out, but in some situations the shortstop will appear not to get to balls that indeed are outs. Posted by StatsGuru at 09:35 AM
| Comments (4)
| TrackBack (0)
February 07, 2005
Run Estimation
Permalink Curveblog has a couple of post up on David Eckstein's range and what it's costing in terms of runs. I have to disagree with something: re the cost of dave eckstein�s poor range, a poster calling him/herself "anolis" asks an intelligent question: That seems real high to me, also. Unfortunately, I can't think too well right now (as I write this I find I wish I hadn't started, it's very difficult to concentrate). But 44 outs means that Eckstein is adding less than two extra games of offense to his opponents. If the opponents score about 4.5 runs per game, than Eckstein should cost his team 4.5*(44/27) runs, or a little over 7 runs. Bill James showed over 20 years ago that the difference between the best and worst fielding shortstops couldn't be more than 25 runs a season. So I don't think David's fielding cost his team anywhere near 33 runs. Posted by StatsGuru at 11:50 AM
| Comments (6)
| TrackBack (0)
February 04, 2005
Directionality
Permalink Yesterday's Probabilistic Model of Range post on rightfielders showed Sammy Sosa doing better than Ichiro Suzuki. I wanted to investigate further why that might be true. The next two tables show the two outfielders broken down by the direction the ball was hit. Lower numbers are toward the third base lines, higher numbers are are toward the first base line. Seven and eight make up straight-away center field.
We have an interesting paradox here. If you define range as the ability to cover more ground, Suzuki is clearly your man. But I'm defining range as the ability to turn a batted ball into an out, and Sosa wins on that count. Why? My speculation from the data is that Sosa stays in one place. There's a reason outfielders are positioned a certain way; that's where most of the balls are hit. Sosa, by staying in straight-away right, gets to all the easy balls. My guess is that Ichrio (due to his great speed), cheats toward center or the line when he thinks a batter might go that way. So he gets to more balls in the alleys and down the line, but he loses a few easy balls straight away. This is where incorporating a weighting by type of hit will improve this model. A commentor on the original post stated:
What we may have here is an OBA vs. Slugging argument in reverse. Ichiro is catching balls that would be doubles or triples. He's lowering the opposition's slugging percentage. Sosa is making all the easy plays. He's lowering the opposition's on-base average. More research will be needed to ascertain if the trade-off is worth while. Posted by StatsGuru at 08:42 AM
| Comments (31)
| TrackBack (1)
February 03, 2005
Probabilistic Model of Range, Rightfielders
Permalink In the continuing series, here's the table for 2004 rightfielders. The results were certainly surprising to me.
The conventional wisdom about Sammy Sosa is summed up nicely in a comment to this post:
The other thing I find very troubling about this list is the position of Ichiro Suzuki. If I could name one right fielder who I would think had extraordinary range, it would be Ichiro. The model I'm presenting is very simple, and I'm aware of it's flaws and limitations. All of your comments have been very helpful in that regard. I'm going to push forward with the model as is for the rest of the postions before I start trying to improve the calculation, however. This way, we'll have a good baseline for comparison. Of course, it could be that Sosa isn't as bad as we believe and Ichiro is positioning himself to make great plays at the expense of easy ones. I'll probably present a more detailed breakdown of the two shortly. Posted by StatsGuru at 09:24 AM
| Comments (19)
| TrackBack (0)
February 01, 2005
Probabilistic Model of Range, Third Basemen
Permalink For your perusal, the 2004 third basemen.
The Greek God of Walks might also be "death to flying things" at third base. Kevin Youkilis did a great job filling in at third base for the Red Sox this season. I'm not surprised to see Scott Rolen as the top everyday third baseman, but I am surprised to see Chipper Jones rate that highly. And A-Rod aquitted himself well in the move to a new position. Overall, you'll notice that the third basmen are as positive as the shortstops are negative. I wonder if shifts have become so prevalent that third basemen are picking up a lot of balls that shortstops usually field. I've certainly scored games this season where the third baseman caught the ball at the bag at 2nd base. If the shift was being use a lot more than in 2002 and 2003, that might account for us seeing third basemen positive and shortstops negative. Posted by StatsGuru at 07:25 PM
| Comments (9)
| TrackBack (2)
What is Range?
Permalink Michael Humphreys writes:
There has also been discussion about UZR showing David Eckstein doing well and while my system shows him doing badly. Let's break Eckstein down by ball in play type:
As you can see, fly balls and liners are hurting Eckstein. He's not great on grounders, but his inability to chase down pop ups is hurting him. This makes me wonder if catching pops is helping Jeter, since we all remember his great dive into the stands from last season.
Jeter is much better at balls in the air than balls on the ground. (Maybe the Yankees should move Jeter to centerfield and find a shortstop who can field grounders.) In fact, if you want a shortstop who fields grounders, you'd pick Eckstein over Jeter. Let's just finish this up with a high ranking shortstop in PMR, Cristian Guzman.
It's clear that Guzman's high ranking comes from his catching line drives in 2004, although he's also better than both Jeter and Eckstein at fielding grounders. But these examples bring me back to the title of this post, "What is Range?" We like to think of range as the ability of a fielder to cover ground. That's really difficult to measure, since as far as I know, no one is keeping track of where each fielder is located on a pitch, or how far the fielder moved to catch a ball. What we can measure is the ability of a fielder to turn a batted ball into an out. Fielders can turn balls into outs because:
I'm sure readers can suggest other things. But basically, if you move well, your positioning becomes less important. Guzman appears to be positioned well, since he's often in the way of line drives. Jeter appears to move well when the ball is in the air, not so much on the ground. I'd guess Jeter's position is poor, also. There's no evidence that Eckstein moves well, but I bet he's positioned better than Derek. Remember, this is me hypothesizing, I don't have any facts to back this up. But should we really just look at ground balls for shortstops as the measure of ability at the position? There's a reason that shortstops and second basemen field a lot of popups, especially behind first and third; they're easier plays for the middle infielders. They have a better angle to the ball. And if one of those popups falls in, a speedy runner will turn it into a double. It's a weakness for Eckstein, and should be noted as such. It's a strength for Jeter, and should be noted as such. As for Guzman's positioning, I'll have to look at multiple years fo data. It easily could be dumb luck. It could be that the Twins staff told him where to go, and it won't carry over to Washington. But it could also be that Guzman can read the batter, and knowing the pitch can make a very good guess at where the ball will go. That would be a strength that should be reflected in the numbers. So to me, range is the ability to get an out on a ball, and good range comes from getting more of these than expected. I don't care how you get to them; the model adjusts for that. Posted by StatsGuru at 10:41 AM
| Comments (12)
| TrackBack (0)
January 31, 2005
Outs to Runs
Permalink Chronicles of the lads is working on converting the Probabilistic Model of Range numbers to runs. Start with the previous link and work forward in time. Update: It's open source basebal research! Posted by StatsGuru at 07:49 PM
| Comments (0)
| TrackBack (0)
Probabilistic Model of Range, Centerfielders
Permalink Here is the table lising 2004 centerfielders on the field for 1000 balls in play.
The first thing I notice is that Andruw Jones is very good and Bernie Williams is very bad. So in this case the system appears to be getting the end points right. The thing that really surprises me is the equality of Biggio and Beltran. Here's a table comparing them just with the Astros:
Beltran was much better with the Astros than Biggio; his poor fielding was a result of his time with Kansas City last year.
So the question for the Mets is, which Beltran will show up in centerfield next season? Neither is better than Cameron, and one is a lot worse. Posted by StatsGuru at 01:40 PM
| Comments (11)
| TrackBack (0)
Thoughts on Range
Permalink There's a great discussion of the Probabilistic Model of Range going on at Dodger Thoughts. I was going to leave the following comment, but I keep getting an error so I'll leave it here. I think it's important to realize that I'm not measuring total defense here, I'm simply trying to measure range. So turning double plays is important, but I'm not trying to measure that here. Posted by StatsGuru at 12:59 PM
| Comments (1)
| TrackBack (0)
Phillies Phielding
Permalink Tom G likes what the Probabilistic Model of Range is telling him about the Phillies defense and the composition of the pitching staff. Posted by StatsGuru at 12:35 PM
| Comments (0)
| TrackBack (0)
Nomar Trade
Permalink Edward Cossette and others have raised objections to my characterization of the Nomar deal (see comments). Edward writes: To me, your data only confirms the veracity to Theo's reasoning that defense was the reason for the trade. I'm willing to admit that Edward has a point. So I'm going to step back from my earlier statement and look at the numbers again. There are two things I look at as a stat guy. One is the number, the second is the context. A month and a half is a short time frame for an evaluation. Anything can happen in 100 or so AB (look at Jeter's April hitting numbers). And anything can happen on 100 ground balls or so. Nomar came back rusty. You can see it in his June hitting numbers. But by July he had recovered his swing. Why wouldn't his fielding numbers come back also? He did show range improvement in July, but his numbers were still poor. What was the context for believing the small sample size of poor fielding numbers were valid? And I will admit that I haven't looked at context either. One is the context of his injury. I don't know how well the injury healed. It was good enough that he could hit well, but not good enough that he could play everyday. Obviously, the Cubs thought the injury healed well enough that they were willing to take Nomar in trade. It's possible that the Red Sox thought that Nomar's poor range would not improve due to the tenderness of his foot. That proved to be incorrect. The other is the long term context of Nomar's fielding. Were his poor fielding numbers the continuation of a trend? This one I can research. Yes, it was the continuation of a trend. In both 2002 and 2003, Nomar ranked near the bottom of the pack in PMR for shortstops on the field for 1000 balls in play. In 2002, he ranked 31 out of 36. In 2003, he ranked 28 of 38. Was his range costing the Red Sox outs? Yes. Nomar's offense, however, was making up for his defense. He did earn 52 win shares over 2002-2003. So, with Nomar's offense fine, did Theo really believe that Nomar's defense was costing them that much? Remember, the difference between a really great defensive shortstop and a really bad defensive shortstop over a full full season is 2 or 3 wins. And while Cabrera was good, he wasn't great. So you're talking about maybe 1 win defensively with Cabrera playing instead of Garciaparra. That doesn't seem to me to justify a trade on defense, especially when it's not a long term solution. As it turns out, Nomar earned 1.7 defensive win shares with the Cubs, and Cabrera earned 1.7 with the Red Sox. Overall, Nomar had 6 win shares with the Cubs, Cabrera 5 with the Red Sox. The tangible evidence says the Red Sox would have done about the same with Nomar or Cabrera at short. The tangible evidence says defense wasn't that important. The tangible evidence says the Red Sox drew the wrong conclusion from 1 1/2 months of fielding data. The intangible evidence says it was a great trade. Theo trades, runs allowed per game go down, runs scored per game go up and the Red Sox win the World Series. And every once in a while, Soriano swings at a low outside pitch and hits a home run. It's about process. Maybe this trade was about changing the personality of the team. That's fine, but I'd like to be told that rather than some fluff about defense. Maybe it was just that the Red Sox didn't want Nomar long term and tried to get what they could for him. There's nothing wrong with any of that, but they would have been rid of Garciaparra by the end of the year anyway. Here's what I believe. Theo didn't go to ownership and say, "We have to trade Nomar because he's killing us defensively." I believe ownership came to Theo and said, "Get what you can for Nomar, and find a way to justify it." And yes, that's pure speculation. But I know Theo is a very smart guy and knows about sample sizes. I know he has a very good handle on the value of defense vs. offense. And knowing that, the explanation for the deal does not make sense to me. Posted by StatsGuru at 08:38 AM
| Comments (2)
| TrackBack (0)
January 30, 2005
Probabilistic Model of Range, Second Basemen
Permalink Here's the table for major league second basemen in 2004. Again, fielders are included if they were on the field for 1000 balls in play.
Like the shortstops it wasn't a good fielding season for the second basemen overall. This table does give some credence to the idea that Jeff Kent is a better fielder than conventional wisdom says. I hope someday to improve this program to a point where it's similar to whatever DePodesta uses. This list should also make Phillies fans happy. They appear to have two of best in Utley and Polanco. And while Nick Green didn't add much to the Atlanta offense, he ate up balls at 2nd last season. At the other end of the scale, the Yankees look like they actually upgraded their range at second replacing Cairo with Womack. And if defense is so important to the Red Sox, I wonder how long Mark Bellhorn will last at 2nd. Posted by StatsGuru at 05:33 PM
| Comments (3)
| TrackBack (2)
January 29, 2005
Probabilistic Model of Range, Shortstops
Permalink It's time to start looking at individual players. We'll start with the position to get the most opportunities, the shortstops. As the following table shows, it wasn't a great season for these middle infielders.
One hypothesis for the overall poor play by shortstops in 2004 is the aging of the big players. Vizquel, Jeter, Garciaparra and Tejada are not youngsters anymore. A-Rod moving out of the position hurt also. All of these players will be a year older in 2005; it will be interesting to see if there is further decline in the position as a whole. It looks like the Nationals got a decent vacuum cleaner at short with their signing of Christian Guzman. With all the talk about Rich Aurilia being old and broken down, he did a very good job fielding. It also appears that the Angels got a nice upgrade replacing Eckstein with Cabrera. If Eck fields like that for the Cardinals, don't expect that team to be number one in defense again next season. Pokey Reese, who was supposed to spend most of his time at 2nd base before the Nomar Garciaparra injury, had the best range at shortstop in the majors in 2004. Nomar was down near the bottom. This gives us a chance to evaluate the Red Sox shortstops.
So if we go back to the Garciaparra/Cabrera trade, we can now see it in it's full light. It wasn't that the Red Sox defense had been bad all year; it's that it was bad with Nomar at shortstop. With Reese injured, Boston figured they needed another fielder at the position. However, Boston may have jumped the gun. There's some evidence that Nomar was just rusty. Compare Nomar with Cabrera after the trade:
So after the trade, Garciaparra had better range than Cabrera. Yes, Cabrera was able to play more. The uncertainty of Nomar's future health was certainly a factor in the deal. But given Nomar's play the rest of the way, Boston could have done without the trade and been just as good on defense, with Crespo or Reese (once he got off the DL) spelling Nomar occasionally. I felt at the time that defense was an excuse to move a player the Red Sox no longer wanted. This data does nothing to change my mind on the matter. Posted by StatsGuru at 05:40 PM
| Comments (20)
| TrackBack (3)
Probabilistic Model of Range
Permalink I've been working on the software for this during the week, and have acquired updated ball in play data as well. I'm now ready to go full bore with the study. First, however, an update of a couple of tables shown previously. The good people at Baseball Info Solutions have been busy recording batted ball information this winter to complete the database, and that new data is included in the following table. This should replace the table found here.
The order of team changes a bit, but not much. It still looks like a poor defensive season overall. The other chart to update had to do with performance behind pitchers, and that's updated in the extended entry. Posted by StatsGuru at 03:36 PM
| Comments (0)
| TrackBack (1)
January 24, 2005
Behind the Pitcher
Permalink Update: I have improved data for the models, so I've updated the tables in a new post. They are in the extended entry. The order changes a little, but not enough to make a big difference. Something easy for me to do with the software I'm developing is to look at the defense behind particular pitchers with the Probabilistic Model of Range. The following chart lists every pitcher with at least 300 balls in play against him for a particular team.
The thing that struck me when I looked at this table was Curt Schilling at the top and Derek Lowe very close to the bottom. On the same team, with pretty much the same defense, Schilling received 28 more outs that expected (that's a whole nine innings worth of outs) and Lowe missed almost as many, -25. So what's going on? Here's a closer look at the pitchers on the Red Sox.
If there's a pattern here, I'm not sure what it is, except that Wakefield and Lowe had the lowest K per 9 in this group. What we really could be seeing is how pitchers effect the balls in play. It could simply be that the balls put into play against Schilling are easier to field than the balls put into play against Lowe! Voros McCracken's theory is that a pitcher has little to do with a ball in play being turned into an out. Tom Tippet found that that's not really the case, although the effect by the pitcher is small. (Links to both found here.) Maybe we've found a way to quantify that contribution. Of course, it could be all luck. Lowe had a very positive number last year. Schilling was on the plus side, but only by about 6 outs in 2003. Looks like a whole new line of study is opening. Posted by StatsGuru at 06:23 PM
| Comments (10)
| TrackBack (2)
More Range
Permalink As always, I'm getting very good feedback on a Probabilistic Model of Range post. I wanted to address some of the questions. I know we discussed this last year, but I forget the answer: is this data adjusted for ballpark? Ballparks are a parameter of the calculation. The adjustment is built in, rather than added later. For those of us interested in tracking stats and info but unable to wrap their brains around the math and the various acronyms, is there a way to turn the results into something simpler? The simplest way to look at it is to just concentrate on the last column. A negative number means the team performed below expectations. A positive number means they exceeded expectations. Thanks for running your system. I'm confused about the team out totals. It seems that if you add all the teams up, they collectively fielded close to 900 fewer balls than they should have. It's possible that I'm 900 balls short. There can be two reasons for this:
I've run checks and my code looks correct. Given that there were over 120,000 balls in play last season, 900 should not make a big difference in terms of the team averages. This is centered on the three-year average, which is why teams look like they were below average in 2004. Once again, thanks for the feedback. Posted by StatsGuru at 09:08 AM
| Comments (1)
| TrackBack (0)
January 23, 2005
Probabilistic Model of Range
Permalink Update: I have improved data for the models, so I've updated the table in a new post. The order changes a little, but not enough to make a big difference. Sorry, I hit the save instead of the preview button for this post. An explanation will be added shortly.
Explanation: Last year, I worked on a way of measuring range which I called a Probabilistic Model of Range (see the defense archives). I was basically repeating work done by Mitchel Lichtman which he named the Ultimate Zone Rating (UZR). Since Mitchel's work was more mature than mine, and since I had to write new software because the source of my data changed, I did not puruse these ranking for the 2004 season. However, I just learned that Mr. Lichtman is working for the Cardinals (congratulations, Mike!) and won't be publishing his results anymore. There's a niche to fill, so here it goes. I calculate the probability of a ball being turned into an out based on six parameters:
For each ball in play, the program sums the probability of that ball being turned into an out, and that gives us the expected outs. Dividing that by balls in play yields expected defensive efficiency rating (DER). That is compared to the team's actual DER. A good defensive team should have a better DER than it's expected DER. There are differences between this year's and last year's calculation. I'm now using three years of data instead of just one. Also, Baseball Info Solution charts balls differently that STATS, Inc. so there are many more vectors that in the previous system. I believe that actually improves the calculation. Finally, the numbers above are approximate; my database is from early October, and BIS had not input every ball in play yet. Still, it should be enough to get a feel for how good teams were on defense in 2004. The first thing to notice from the table is that it was a poor defensive season overall. Only four teams had a better DER than predicted by the model. The Cardinals and Red Sox were 1-2, and ended up the World Series. The Angels were last, but also made the playoffs. The Yankees continued their abysmal defense, while the Mets high ranking should help explain why so many of their pitchers had better ERAs than DIPS ERAs. The next step is to use this method to evaluate individual fielders. Watch for that in upcoming posts. Update: Just in case I wasn't clear on this, the model is built on three years data, but the chart above is just for 2004. Correction: Corrected the spelling of Mitchel Lichtman's name.Posted by StatsGuru at 01:38 PM
| Comments (24)
| TrackBack (5)
January 19, 2005
To Move or Not To Move
Permalink Mike Cameron has broken his silence on the Mets decision to move him to right field: Cameron, whose reservations about moving to right field had made him the subject of trade discussions, announced last night that he is now preparing to switch to right after all, a revelation that should keep the two-time Gold Glover in New York. Later he added: "I had reservations about it for the simple reason of I've never done it before," said Cameron, who did not exactly sound thrilled about his new position last night. "The one thing we came to terms with [yesterday] was I'm here to do what's in the best interests of the ballclub and try to put this team back on the map." This appeared to be very important to the Mets, as a management contingent visited the former CF. On their way down to their Dominican Republic baseball facility, Jeff Wilpon, Omar Minaya, Jim Duquette, Tony Bernazard and Willie Randolph stopped to visit Cameron at his Atlanta home. Cameron said the meeting was critical and answered a multitude of questions he had about moving. The Mets thought it necessary, too, especially to let Cameron know, in Minaya's words, "We don't take a change like [switching positions] for granted."
Posted by StatsGuru at 09:34 AM
| Comments (0)
| TrackBack (0)
December 17, 2004
Third Base!
Permalink I'd like to expand on a couple of ideas that are floating through the comments on the Beltre signing and the Randy Johnson trade. The first is that the Beltre's career is inconsistent with his 2004 season. While that's true, as I said in this post,
But more telling, I believe, is that DePodesta offered six years guaranteed, although at a lower yearly rate (how much lower isn't clear). That DePodesta made that kind of offer tells me Paul believes there's a lot of future value in Beltre. The second idea is that it's okay for the Yankees to trade Eric Duncan because A-Rod is blocking him at third. This reminds me of the Red Sox trading Jeff Bagwell because Scott Cooper was blocking him at third. Remember the defensive spectrum: <-- Increasing need for defense P C SS 2B CF 3B RF LF 1B DH Increasing need for offense --> A good offensive player who is blocked at third has plenty of room to move right on this spectrum. And a great defensive third baseman can actually move left to 2nd or even short. Remember Cal Ripken? I don't know enough about Duncan to say where he could be moved, but the idea that he couldn't play on the Yankees because of A-Rod is incorrect. Update: ESPN is saying that the Johnson deal is not as close as reported last night. Posted by StatsGuru at 08:33 AM
| Comments (12)
| TrackBack (0)
November 08, 2004
Expert Knowledge
Permalink Tangotiger is once again asking fans to fill in a survey to help determine who are the best fielders in the major leagues. If you've watched many games this season, take a few minutes to fill out his forms. Posted by StatsGuru at 08:13 AM
| Comments (2)
| TrackBack (0)
October 27, 2004
Rightfield Goalie
Permalink Lost in the Cardinals ineptitude this series is the fine defensive play by Larry Walker. He's made good catches, and at least three times he's held hard hit balls over his head to singles. He just cut off a Nixon double in the outfield with a terrific slide and scoop to prevent a triple. Posted by StatsGuru at 08:54 PM
| TrackBack (0)
October 21, 2004
I Can Be, Centerfield
Permalink Jim Edmonds just made one of the finest catches you'll ever see. Watching games, one gets a good feel for when players are going to make a catch or not. I didn't think he had a chance at this one. But Edmonds turned on the after burners, dove, and made a spectacular catch going toward the wall. He saved two runs for the Cardinals. The Astros are getting the ball in the air against Suppan. He tends to get ground balls, so that's not a good sign for Jeff. Posted by StatsGuru at 08:51 PM
| TrackBack (0)
October 20, 2004
No Arm
Permalink With Pujols and Rolen on first and second, Edmonds hits a fly ball to left. It was deep, but it wasn't to the warning track. Pujols and Edmonds both tagged up and Biggio's throw to third wasn't close. Renteria comes through with his 2nd hit of the game to drive both in. A great example of exploiting a weakness. Update: And it chases Munro. Harville is on to try to put out the fire. Update: Harville gives up a double to Sanders. St. Louis is finally showing some offensive depth in the series. Update: Harville comes back to strike out the M&M battery. It's 4-2 after three. Slugfest, anyone? Posted by StatsGuru at 05:18 PM
| TrackBack (0)
October 13, 2004
Berkman Bumbles
Permalink Lance Berkman looked like he got his foot caught on a Larry Walker line drive, and Larry winds up on third. The Cards power doesn't need any help from the opposition defense. Update: Yep. Pujols follows with his own 2-run homer to tie the game with 1 out in the first. Posted by StatsGuru at 08:36 PM
| TrackBack (0)
September 23, 2004
Speed and Defense
Permalink
Posted by StatsGuru at 08:09 PM
| TrackBack (0)
September 18, 2004
Starting Defense
Permalink
Posted by StatsGuru at 02:43 PM
| TrackBack (0)
September 14, 2004
Defense Difference
Permalink Peter Gammons pens a piece on how the Moneyball GM's are looking for new ways to quantify defense.
UZR gets a nice mention in the piece, also. I did some work along these lines last year. Posted by StatsGuru at 01:09 PM
| Comments (1)
| TrackBack (0)
September 02, 2004
Poor Preparation
Permalink The Marlins just scored three runs on a bases loaded single. It was a medium seeing eye hit that trickled through the infield. Hidalgo tried to throw out the runner trying to score from 2nd (2 outs), but the throw got by the catcher, and Seo wasn't backing up, allowing the third run to score. The Mets announcers are ripping Seo for not being in position. When the ball was hit, Seo started for first base, because the ball was not hit hard and he thought he would have to cover. But when the ball went through for a hit, Seo stopped in his tracks and threw his head down as if he were cursing. Only too late did he start for the plate. From the talk of the announcers, it doesn't sound like the first time a Mets pitcher has been out of position on a play like this. To me, that's bad coaching. My feeling is that managers have two main functions in regards to the game; making sure the players are prepared (well coached), and putting individuals into situations where their is a high probability of success. It looks like the Mets coaching staff is failing in the preparedness arena. Posted by StatsGuru at 01:47 PM
| TrackBack (0)
August 16, 2004
Doug's Defense
Permalink The Red Sox are starting Doug Mientkiewicz at second base tonight, due to injuries. He played in one game there for the Twins in 2003, but did not get a chance to make a play. In the first inning tonight, with a man on 1st and 1 out, Wells hit a ball up the middle. Doug made a nice play to glove the ball, step on 2nd for the force, then an off-balance throw to get Wells at first and complete the DP. Not bad for a first baseman. He certainly hits more like a 2nd baseman. Maybe this is the start of a new career. :-) Posted by StatsGuru at 07:12 PM
| Comments (6)
| TrackBack (0)
July 28, 2004
Lee's Artillery
Permalink Nice play by Carlos Lee to start off the Twins-White Sox game. Stewart hits the ball between the third baseman and the line. It looks like a sure double, but Lee gets over quickly, barehands the ball and fires a strike to get Shannon at second. Posted by StatsGuru at 02:10 PM
| TrackBack (0)
July 13, 2004
Tough Night
Permalink Sammy Sosa had a tough first couple of balls. Ichiro and Pudge each sent low fly balls to the fence in the right field corner, and Sosa couldn't come up with either. The double and triple end Roger Clemens streak of not allowing a base runner as a starter in the All-Star game. The AL may hit for the cycle this inning. Manny just hit a 1-out, 2-run homer. Update: After Giambi reaches on a Kent error, Jeter singles for the cycle. According to Fox, it was the first time a double, triple and HR had been hit in the same inning in the All-Star game, so it's also the first time a cycle has been hit in the inning. Soriano follows up with a three-run HR, and the AL leads 6-0. Mulder gets to bat before he gets to pitch. Update: Mulder strikes out to end the inning. Six runs, three earned for Clemens in the first. Posted by StatsGuru at 08:52 PM
| Comments (7)
| TrackBack (0)
July 07, 2004
Cool Play
Permalink Ramon Martinez, shortstop for the Cubs, just made a neat catch. Jenkins popped one up into the outfield between third and short. Instead of getting under the ball, Martinez made an underhand/backhand catch to the side of his body, and he did it so nonchalantly that it looked like he did it all the time. That made 3-4 hitters 0 for 3 in the game so far, as Davis got Sosa and Alou in the first. Posted by StatsGuru at 08:23 PM
| Comments (3)
| TrackBack (0)
July 01, 2004
All Out
Permalink I complain about Derek Jeter's defense a lot, but he just made one of those plays that makes it easy to forgive him for his limited range on ground balls. Men on 2nd and 3rd in the top of the 12th, two outs, Nixon hits a flair down the left field line. Jeter went all out, caught the ball in fair territory, and then his momentum carried him head first into the stands. He came out bloodied, but he held on to the ball. He played it like it was the 7th game of the world series. Giambi will bat for him in the bottom of the 12th after a Cairo triple leading off the inning. Update: Millar comes in from the outfield to be a fifth infielder. Big shift on Giambi, but Millar is playing as if he's at third. Update: Giambi strikes out. He looks thin after his illness. Update: They put a shift on for Sheffield, moving Millar to first this time, but Leskanic hits Sheffield. 1st and 3rd with one out for A-Rod, and Millar moves back to the outfield. Update: A-Rod is walked to load the bases. Millar is coming back into the infield to play first and McCarty is moved between 2nd and 1st again. Bubba Crosby batting. Update: Crosby grounds to Reese, who gets the force at the plate. It's up to Bernie Williams, who is 0 for 5 today, defense back to normal. Update:Williams strikes out, and looked bad doing so. To the 13th. This is one of the best Yankees-Red Sox game I've seen in a long time. Both teams have had plenty of chances, but great plays and great pitching in tough situations have prevailed so far. Posted by StatsGuru at 10:55 PM
| Comments (5)
| TrackBack (0)
June 30, 2004
Deja Vu All Over Again
Permalink I'm just wondering how many Red Sox fans flashed back to Bill Buckner when the ball went by Ortiz for two runs? Posted by StatsGuru at 11:12 PM
| Comments (3)
| TrackBack (0)
Lost in the Sun, Lost for a Run
Permalink Craig Biggio popped up the first pitch from Matt Clement, but Aramis Ramirez lost the ball in the sun and let it drop in foul territory. Biggo took the next pitch into the stands for a HR. Ramirez was not given an error on the dropped fly, so it will be an earned run against Clement. Posted by StatsGuru at 02:27 PM
| TrackBack (0)
June 26, 2004
Where to Throw?
Permalink I saw one of the worst defensive plays I've ever seen today in the Mets-Yankees game. In the top of the fourth, with runners on 1st and third, Reyes tries to steal 2nd. Halsey, however, has Reyes picked off. Giambi takes the ball, and instead of turning and throwing to 2nd, looks at the runner at third, Phillips, who is going nowhere. Giambi misses his chance to get Reyes, never even throwing to 2nd for what should have been an easy out. Kaz Matsui then singles in both runners, chasing Halsey from the game. Halsey did not have his control today, walking five. So you can't blame his early departure on Giambi. But Jason, although not charged with an error, cost the young lefty a run. Al Leiter gets only his third win in 12 starts, despite a 2.34 ERA. He struggled at times, but shutdown A-Rod and Giambi, who were batting with plenty of men on base today. Posted by StatsGuru at 05:13 PM
| Comments (2)
| TrackBack (0)
June 17, 2004
Chipping In
Permalink Andrew Godfrey points out the Chipper Jones has moved back to third base. Atlanta has had the worst offensive third basemen in the league this year, mostly Mark DeRosa. However, they've replaced Jones in LF with former Cardinals catcher Eli Marrero, who is not exactly a great offensive player, either. Part of the move is due to Chipper's injury:
The question for me is, what are the Braves going to do long term. Chipper was moved to left field, after all, because he's not a good third baseman. So do the Braves look for a hitter who can play left field (not that hard to find) or a glove man who can play third base and hit enough so as not to be a liability (harder to find)? Posted by StatsGuru at 11:06 AM
| Comments (1)
| TrackBack (0)
June 15, 2004
Three for Two
Permalink The sports section of my local paper, The Republican, had this column by Garry Brown entitled "Pokey's the (Glove) Man." In it, Brown argues that Youkilis should be benched, Bellhorn should be playing third and Reese should be the everyday second baseman.
Is that indeed the best combination for the Red Sox? Let's look at the win shares, shall we?
The two things I see from this data is that Youkilis is generating wins at twice the rate of Pokey Reese. When you're in second, 3 1/2 games back, generating wins is the most important thing to do! The second thing I see is that Reese and Bellhorn are about even in defense. Reese should be ahead due to the fact that he's been playing short most of the year, which gives you a bonus in win shares. So the fact that they're that close tells me that Bellhorn has been doing a good job at 2nd base. Right now, the lineup that will give the Red Sox the best chance of winning has Youkilis at third and Bellhorn at 2nd. Use Pokey when Lowe pitches or as a late inning defensive replacement. But don't start him everyday just because he makes a spectacular play once in a while. Posted by StatsGuru at 09:09 AM
| Comments (9)
| TrackBack (0)
June 13, 2004
Damon's Defense
Permalink Fielding win shares have a bias toward the more difficult defensive positions. So you would expect catchers, shortstops and 2nd basemen to accumulate the most defensive win shares. So it's impressive that Johnny Damon is leading the AL in this category. I'm also impressed to see Marco Scutaro as the best middle infielder in the league. Posted by StatsGuru at 09:37 PM
| TrackBack (0)
June 02, 2004
Florida Backstop
Permalink Matt Treanor, a 28 year-old catcher, is making his major league debut for the Marlins today, answering the question about who would be the solution to the Fish's backstop problems. Posted by StatsGuru at 01:21 PM
| Comments (1)
| TrackBack (0)
June 01, 2004
Catching On
Permalink The Marlins are a bit short behind the plate tonight. With Mike Redmond injured, Ramon Castro went down in the 2nd. Mike Mordecai has taken over behind the plate, the 2nd time he's been called upon to catch in his major league career. He's done a good job; as the announcers observed, they haven't had to comment on the job he's doing, so Mike's getting it done. There have been a couple of stolen bases against him, but the one I saw, the throw from Mike was real close. The real question, what are the Marlins going to do long term if both Redmond and Castro are injured? Posted by StatsGuru at 09:28 PM
| TrackBack (0)
May 21, 2004
Nice Play
Permalink I complain about Derek Jeter's defense enough, but I just saw him make a very nice play. He ranged past 2nd base to take a hit away from Michael Young and throw him out at first. Jeter appears to be moving faster in the field this year. Posted by StatsGuru at 09:06 PM
| Comments (4)
| TrackBack (0)
May 19, 2004
DBacks Defense
Permalink Bob McManaman takes a look at the defense that helped Johnson score a perfect game last night. It was tough to see the ball last night, and Steve Finley used the Mike Cameron method of going to where he thinks the ball will land.
It should be noted that Johnson striking out nearly half the batters meant that the defense didn't have as much to do. Nonetheless, they performed flawlessly as well. Posted by StatsGuru at 10:13 AM
| TrackBack (0)
Guerrero's Gun
Permalink Posada at 2nd, two out, top of the 9th. Bernie Williams lines a single into right. It's not hit that hard, so Posada tries to score, but Vlad throws a perfect strike to Jose Molina at catcher to nab Posada at the plate. It's the third baserunning blunder of the game for the Yankees. What I want to know is, why didn't they pinch run for Posada? Is there no one on the bench faster than him? Also, it looks like on the replay that the ball beat Posada, but not the tag. He sure looked safe in slow motion. Update: The Angels make their own baserunning blunder. Guillen leads off the ninth with a single, and is pinch run for with Amezaga. Amezaga then gets himself picked off. This game will make a good lesson on how not to run the bases. Posted by StatsGuru at 12:43 AM
| Comments (7)
| TrackBack (0)
May 17, 2004
Heads Up Play
Permalink Mike at Mike's Baseball Rants documents a play by Tomas Perez and clarifies the infield fly rule. Posted by StatsGuru at 10:09 AM
| Comments (3)
| TrackBack (0)
May 12, 2004
Glove Men
Permalink Steve Bonner writes to me that the Yankees defense has improved, and he gives a humorous explanation why. However, he doesn't list DER, so gave a look to the graphs at The Hardball Times (scroll down to the pitching and fielding graph). It shows the Yankees with an above average DER! I, for one, am shocked. Let's start with my favorite whipping boy, Derek Jeter. Jeter is above average in range factor this year, for the first time in his career. Now, there are a lot of problems with range factor; it's highly influenced by a team's pitching staff. And while Kevin Brown may be getting more ground balls to the infield, the lack of lefties in the Yankees rotation means they are seeing fewer right-handed batters. (A quick check confirms this. Last year 56.8% of opposition AB were by right handers, this year, 55%.) So Jeter is doing something to make more plays. Maybe A-Rod is saying, "I would have had that," everytime a ball goes under Jeter's glove. Or maybe Jeter took all the Rodriguez should play short arguments to heart and actually did something about his defense. Either way, it's working. I suspect Bernie Williams move mostly out of centerfield has a made a big difference too. Kenny Lofton is still an above average CF, while Bernie just can't chase down fly balls anymore. The defense looks stronger at two positions that have been weak over the last few years. That's a very good sign for Yankees fans. Posted by StatsGuru at 11:48 AM
| Comments (2)
| TrackBack (0)
May 06, 2004
Triple Play
Permalink The Braves just turned a 5-4-3 triple play. Kerry Robinson was the batter, who hit a hard grounder to third where Hessman stepped on the bag, then fired around the horn to end the inning. Posted by StatsGuru at 03:11 PM
| Comments (2)
| TrackBack (0)
May 01, 2004
Shorted Battery?
Permalink Mike Cusick sends me a link to this article about the poor relationship between the Giants pitchers and A.J. Pierzynski.
Does anyone know if this went on when he was with the Twins? That's pretty poor form, not to go over hitters with the starter before the game. Mike is wondering if this is why the Giants pitchers are doing so poorly. I don't know, but it's a good place to start laying blame. Posted by StatsGuru at 02:17 PM
| Comments (3)
| TrackBack (0)
April 21, 2004
Close, but No Cigar
Permalink Jason Schmidt allowed a leadoff triple to Terrance Long in the 2nd. He got a groundout and a strikeout to keep Long at third and face the opposing pitcher. But Peavy hit the ball to the hole side of shortstop, and Perez couldn't backhand it and wound up with an error. Since Neifi's main job is to play defense, it would be nice for him to come up with the tough plays. Bonds strikes out to start the 2nd for the Giants. Posted by StatsGuru at 10:40 PM
| Comments (1)
| TrackBack (0)
Expos Win
Permalink A nice win by the Expos tonight. They threw out two Mets at the plate to preserve a 2-1 victory. Glavine pitched well enough to win, but Livan Hernandez pitched better tonight. Posted by StatsGuru at 09:55 PM
| TrackBack (0)
April 20, 2004
Who's on Second?
Permalink The Red Sox have an interesting problem shaping up at 2nd base, albeit a good one to have. With both Bellhorn and Reese playing, Mark is showing that he's a supreior offensive player to Pokey. Bellhorn's OBA is almost twice as high as Reese's. When Garciaparra comes back from his injury, the Red Sox will need to decide if they want Reese's defense or Bellhorn's ability to get on base in the lineup everyday. Posted by StatsGuru at 07:59 PM
| Comments (5)
| TrackBack (0)
April 09, 2004
New Kid on the Knoblauch
Permalink Michael Young just made consecutive throwing errors. The threw wide to first, then on a double play ball, threw past Soriano. You might say he "Chucked" them. Update: Adam Kennedy makes the errors very costly as he hits a three-run HR to give the Angels a 3-1 lead. Young gets his arm back to throw out Eckstein for the 2nd out. Posted by StatsGuru at 02:40 PM
| Comments (1)
| TrackBack (0)
April 08, 2004
Slugfest?
Permalink I was scoring the Mets-Braves game last night for work. One of the things I love about scoring is that it really makes you pay attention to what is going on. I told my wife the score (18-10), and she asked if that was a slugfest. I said yes, but after sleeping on it, I'm not sure that was correct. It seems to me it was an example of the deadly combination of having a pitching staff that doesn't strike out batters combined with a porous defense. The Braves had 19 hits, but 13 were singles, and only one was a HR. There were any number of balls hit that better fielders would have at least kept on the infield. Wigginton looked particularly bad to me; I kept seeing balls go by him that good third basemen would have dove. Ty seemed frozen on his feet. I was also more impressed with Kaz Matsui's offense than his defense. He was selective at the plate and looks like a very good hitter. But I expected him to be a wizard with the glove, and last night he looked more like Derek Jeter than Ozzie Smith. Scoring ten runs was great, but they are going to need to do that quite often if they are going to win regularly with that defense. Posted by StatsGuru at 09:39 AM
| Comments (5)
| TrackBack (0)
April 07, 2004
In or Out?
Permalink The DRays have loaded the bases against Rivera in the 9th with 1 out. The Yankees are playing the infield back, except for Clark at first. Sort of the opposite of the end of the 2001 World Series, where the Yankees brought the infield in and Luis Gonzalez popped one over Jeter. Torre makes the right decision this time as Fordyce grounds into a 5-3 double play to end the game. Posted by StatsGuru at 06:49 PM
| Comments (3)
| TrackBack (0)
Kotsave
Permalink Soriano just got a hold of one, and Mark Kotsay made an amazing grab. Kelty had lost the ball, and Mark came out of nowhere to make a one-handed grab at the 362 mark in left-center. Posted by StatsGuru at 04:20 PM
| Comments (1)
| TrackBack (0)
April 04, 2004
Worth the Money
Permalink Miguel Tejada has really impressed me with his defense tonight. He's smooth, he fields cleanly, has a rifle of an arm, and isn't afraid to stay in on the double play. The Orioles fans are in for a real treat this year. Posted by StatsGuru at 10:24 PM
| Comments (1)
| TrackBack (0)
Heads Up
Permalink Johnny Damon hits a slow roller down the first base line. Ponson alertly hits Damon in the back with the ball, because he was running inside the baseline. Nice heads up play by Ponson. Posted by StatsGuru at 09:06 PM
| Comments (5)
| TrackBack (0)
Oops!
Permalink Mazilli send Bigbie up to bunt with no out and runners on 1st and 2nd. Bigbie quickly gets two strikes, but nubs one back to the mound. Pedro's only play is at first, but he looks at second, then throws wildly, allowing a run to score and men on 2nd and 3rd. Pedro has not been sharp. He hit Segui, he's leaving pitches over the plate, and his control is not there. Matos just got a hit and an RBI. This is not what Red Sox fans want to see. Posted by StatsGuru at 08:48 PM
| TrackBack (0)
Blunder to Blunder
Permalink Mora gets thrown out at third to end the 1st, then with one out makes the Orioles first error of the year, allowing Gabe Kapler to reach first. Not a great way to start the season. Posted by StatsGuru at 08:31 PM
| TrackBack (0)
March 30, 2004
Second to Third
Permalink For the 2nd time in the game, a Devil Ray went from 2nd to 3rd on a fly ball to Kenny Lofton. Posted by StatsGuru at 06:40 AM
| TrackBack (0)
A-Rod's Defense
Permalink I've seen A-Rod have three chances at third, and he's looked very good to me so far. He just stopped a ball from going down the line, but failed to get the runner at 2nd (Sanchez was running on the play). I did get a flashback of Nettles watching that play, and I didn't expect to get that from Alex. Posted by StatsGuru at 06:38 AM
| Comments (2)
| TrackBack (1)
March 23, 2004
Gabe Grab
Permalink Gabe Kapler just made a great play at third base. He's filling in for the injured Bill Mueller, but on that play you'd think he was the regular third baseman. He charged a slow roller, fielded the ball with his glove hand waist high and made a perfect throw to first to catch the runner by a step. Got a great cheer from the crowd, too. Posted by StatsGuru at 02:21 PM
| Comments (2)
| TrackBack (0)
March 21, 2004
Left Out
Permalink I'm watching the Padres-Cubs game, and the Padres have started Ryan Klesko in left field. It's been pretty ugly out there. He missed a short pop. Balls are ricocheting around him. And finally, a long fly was hit to the wall. Klesko went back, but had no idea where the ball would come down. Kingsdale, the centerfielder, came all the way over to left to jump and save a HR. If Klesko is going to be a regular in left, the CF is going to have to do a lot of work to take some pressure off Ryan. Posted by StatsGuru at 03:30 PM
| Comments (4)
| TrackBack (1)
March 15, 2004
Using His Head
Permalink Reggie Sanders just did a header into one of the ads covering the chain link fence at the St. Louis spring ballpark. It looked bad on the replay, but he got up and is still in left field, no worse for wear. Posted by StatsGuru at 02:13 PM
| Comments (1)
| TrackBack (0)
March 05, 2004
Brown Ground
Permalink I'm seeing the potential problems Kevin Brown is going to have this summer. Balls are being hit on the ground, and they are not being handled cleanly. The Phillies have four hits, only one on a line drive. Two outfield assists have kept the Phillies off the scoreboard, but you can't depend on your opponents making baserunning blunders during the regular season. Yankees infielders should be taking a couple of hours of ground balls each every day this spring. Posted by StatsGuru at 01:42 PM
| TrackBack (0)
Early Test
Permalink The first ball in play is hit to A-Rod at third. He didn't look too smooth, backing up and taking the ball on an in-between hop, but he made the play. Update: With Rollins on first, Michaels hit a shot past A-Rod at third, but Matsui threw out Rollins trying to take an extra base. Jeter makes a high throw, but in plenty of time, to end the inning. Brown faced four batters in the inning, got four ground balls but the defense was less than stellar. Posted by StatsGuru at 01:24 PM
| Comments (2)
| TrackBack (0)
March 02, 2004
Fans as Scouts
Permalink TangoTiger has a neat project at BaseballStuff.com. He wants fans to evaluate different attributes of players defense based on what you've seen at the ballpark and on television. I think this is a great idea. Collections of humans can act like a giant multi-processor computer, where each processor is doing the same task in a slightly different way. The aggregate of these opinions is usually the right answer. (That's why football point spreads are so good. They are set by the betting of an enormous group of experts.) If you've seen players enough that you have an opinion about their defense, stop by and fill out the survey. I can't wait to see the results, and how they might compare to other statistical measures of defense. Posted by StatsGuru at 02:38 PM
| Comments (2)
| TrackBack (0)
Catching Flys
Permalink David Gerstman sent me this article in the NY Times about how Mike Cameron goes about chasing down flyballs. I found this part very interesting.
The interesting thing is, that's not how it's done normally. There was a very interesting study done that was published in Science in 1995 showing how players follow fly balls. (I believe they attached cameras to the fielders heads.) The summary of the article is here. Cameron appears to be able to figure out this trajectory without looking, which would be a great advantage. Posted by StatsGuru at 12:21 PM
| Comments (4)
| TrackBack (0)
February 29, 2004
Panning for Gold
Permalink According to this article by Danny Knobler, a member of the Tigers has not won a gold glove award since Gary Pettis in 1989. With the addition of I-Rod and Vina, Knobler thinks that streak might be over. The pitching coach thinks the better defense will help his staff:
According to the Probabilistic Model of Range, the Tigers had the 2nd worst range in the majors last year. Guillen was above average at shortstop last year, while Vina was below average (I don't know how much his injury contributed to that). So they should be improved up the middle this year. However, given what we now know about pitchers being rather unable to control what happens when the ball is put into play, maybe Bob Cluck should rethink his philosophy and try to get his staff to strike out more batters. Posted by StatsGuru at 04:23 PM
| TrackBack (0)
February 17, 2004
Defensive Measures
Permalink Avkash Patel at the raindrops uses four different defensive measures to rate fielders, including my probabilistic model of range. The results are interesing. However, the way runs are calculated using PMR is very simple. UZR, I believe, looks at whether fielders are giving up doubles vs. singles, so my guess is that the runs calculated by UZR are much more accurate at this point. Posted by StatsGuru at 10:17 AM
| TrackBack (0)
February 16, 2004
Left Side Defense
Permalink Jurgen at some calzone for derek takes a look at how good Alex Rodgriuez might be defensively at third base. Posted by StatsGuru at 08:26 AM
| TrackBack (0)
January 29, 2004
Sheffling the Defense
Permalink A number of people have pointed out that Gary Sheffield has offered to play third base for the Yankees (Dom Cento had suggested the idea here):
Sheffield has a reputation as a bit of a selfish player. I especially remember his time in Milwaukee, where it seemed to me he was not playing up to his potential because he didn't want to play there. This seems like a pretty selfless move, but it could also be low risk. Gary may realize that there's little chance of the Yankees making this switch, so he'll come out looking like the good guy. Still, I'm willing to give him the benefit of the doubt and say, "Bravo." It also just goes to show how hard it is to find a good thirdbaseman. Compared to shortstops for example, how many really great third basemen are out there? Rolen, Chavez, maybe Glaus and who? Blalock is still young. Koskie's pretty good, but doesn't get a lot of publicity. After those, however, there's not much. It will be interesting to see how creative (or uncreative) the Yankees get in solving the problem. My solution to use Pudge Posted by StatsGuru at 09:43 AM
| Comments (6)
| TrackBack (0)
January 27, 2004
Sheffielder?
Permalink Dom Cento points out in the comments to this post on Boone that Gary Sheffield used to be a third baseman. Why not move him to third and have three center fielders in the outfield? It'll be a really bad defensive infield, but you don't have to out and buy anymore players. Posted by StatsGuru at 01:44 PM
| Comments (8)
| TrackBack (1)
January 21, 2004
Defensive Regression Analysis
Permalink Michael Humphreys sends this link to a detail DRA summary from 1974-2001, including a spreadsheet you can download. Posted by StatsGuru at 10:23 AM
| Comments (1)
| TrackBack (0)
January 13, 2004
Erstad in the Outfield
Permalink Aaron Gleeman breaks down the Angels options in the outfield and concludes that Erstad is not the person to move to first base. I made a similar comment here. Posted by StatsGuru at 10:49 AM
| Comments (4)
| TrackBack (0)
December 24, 2003
Steve Finley
Permalink To help out with a study comparing my probabilistic model of range to MGL's UZR, here's Steve Finely broken down by field slice and by batted ball type (in the field slice, C would be the third base line and X would be first base. MN is straight away center field):
Looks to me like Finley does not move well laterally. Posted by StatsGuru at 06:28 PM
| TrackBack (0)
December 23, 2003
UZR
Permalink MGL's UZR study for 2003 is up at Baseball Primer. In the disscussion, there's a link that compares my probabilistic system rankings of CF's to UZR. Posted by StatsGuru at 11:18 AM
| Comments (1)
| TrackBack (0)
December 07, 2003
Sortable Tables
Permalink I haven't posted much today, because I've been working on making my probabilistic range tables sortable. This has been fun for me, as I've learned how to write scripts in Python, which will open up lots of chances for me to do interactive projects on this web site. As a sample of what I'm trying to do, click for the chart of probabilistic range for right fieders. Click on any column heading to sort by that column. Posted by StatsGuru at 06:45 PM
| Comments (4)
| TrackBack (0)
December 06, 2003
Probabilistic Range, Right Fielders
Permalink Here's the table for MLB right fielders, minimum 200 balls in play when they're on the field:
Looks like Jose Cruz was the best in 2003. Posted by StatsGuru at 06:59 PM
| Comments (6)
| TrackBack (1)
Probabilistic Range, Center Fielders
Permalink Here are the center fielders, minimum 200 balls in play while they are in center field.
This list looks right to me. Andruw Jones first among regulars, Bernie Williams last. It also confirms that the Yankees should move Matsui to centerfield, and not try to pick up Kenny Lofton. Posted by StatsGuru at 10:40 AM
| Comments (2)
| TrackBack (0)
December 05, 2003
Probabilistic Range, Left Fielders
Permalink Here's the table for left fielders:
Not surprising, the young speedster Carl Crawford does very well among regulars. A bit more surprising is that the old man, Barry Bonds, does very well also. I also don't think it's much of a surprise that Manny Ramirez is near the bottom of the pack. Posted by StatsGuru at 08:43 PM
| Comments (4)
| TrackBack (0)
Probabilistic Range, Second Base
Permalink Here's the chart for all major league 2nd basemen who were on the field for 200 balls in play:
Looks like the Orioles have great defense at 2nd base in Brian Roberts, and Mark Ellis appears to be making up for some of the defensive shortcomings of Scott Hatteberg. I'm not surprised to see Roberto Alomar near the bottom. For years, zone ratings at STATS showed him very low, despite the how good he looked in the field. It also looks like Bret Boone's gold glove wasn't really deserved. Posted by StatsGuru at 05:40 PM
| Comments (7)
| TrackBack (0)
Probabilistic Range, Shortstops
Permalink Here's the chart for shortstops in 2003 (minimum 200 balls in play):
Looking at this, why would Tampa Bay ever go back to Rey Ordonez at SS. Not only is Lugo a good fielder, he can hit better. I'm somewhat surprised that Jeter isn't the worst regular shortstop in the majors, and Tejada isn't much better. Aurilia is rated lower than both of them, yet win shares (according to STATS, Inc.) gives Jeter 1.3 defensive win shares, Aurilia 5.6. In looking at the win shares system for SS, James has four categories he weights 40-30-20-10. In order, they are assists, double plays, errors and putouts. None of these is a pure measure of range, yet all contribute to it. And they are all adjusted by an expectation based on league averages. I'm hoping these two system can be combined to improve the calculation of defensive win shares. Posted by StatsGuru at 07:29 AM
| Comments (9)
| TrackBack (0)
November 22, 2003
Defense At Third
Permalink I wanted to look at individual third basemen next. One reader wondered about Eric Chavez; he had been rated very high by other systems over the last few years, but the Oakland third basemen in total did not do well under this probabilistic system. Chavez comes out about average under this method, but Frank Menechino does most of the damage at the position (based on 200 balls in play when on the field):
Looks like Casey Blake has the best range of the regular third baseman. I haven't seen him play much. Is anyone surprised by that? Posted by StatsGuru at 02:05 PM
| TrackBack (0)
November 21, 2003
Defensive Regression
Permalink Part three of Michael Humphreys defensive regression analysis is up on Baseball Primer. Posted by StatsGuru at 09:30 PM
| TrackBack (0)
First Base Range
Permalink It's time to start looking at the range of individual players. I'm starting with first basemen, since people have noticed the wide disparity between the A's and Devil Rays. This table contains data for all first basemen who were on the field for at least 50 balls in play.
As you can see, Travis Lee is very good, and Scott Hatteberg isn't. Let's see if we can find where the difference is. Let's break the two of them down by batted ball type.
As you can see, Hatteberg is poor at on every batted ball type. Travis Lee is particularly good at catching pop ups. Let's look at the two of them by direction. Direction X represents the first base line, C represents the third base line, M is up the middle.
Posted by StatsGuru at 09:23 PM
| TrackBack (0)
November 14, 2003
Thinking About Range
Permalink I was just thinking about the range model, and it strikes me that the base-out situation may be much more important than the handedness of pitchers or batters. I'll have to check that out. Posted by StatsGuru at 10:11 AM
| TrackBack (0)
November 13, 2003
Helping and Hurting Defenders
Permalink I'm received a number of comments on the probabilistic model of range indicating that people think this system will help answer the question, "How much do pitchers contribute to the hits allowed against them?" One way of looking at this is to look at expected DER. If the expected DER is high, then the pitchers are inducing balls in play that are easy to field. If low, the opposite is true. Here's the team chart sorted on expected DER:
As you can see, the pitchers who gave their defense the easiest balls to field belonged to the staff of the Oakland A's. And the Rangers ranking at the bottom show just how bad that pitching staff was. The next step will be to apply this to individual pitchers. Update: Here's a table of all pitchers with at least 100 balls put in play against them (fieldable balls only). Find your favorite pitcher and see how he did. Notice Gagne was higher than Schmidt, and Schmidt was much higher than Prior. Update: Looks like I can't put the whole pitcher's table in the entry, so I'm redoing it with all pitchers who have had 200 balls put into play against them. There will be another update when that's done. Update: Okay, the final table is in place below. Posted by StatsGuru at 10:43 PM
| TrackBack (0)
Defensive Research Summary
Permalink Tango Tiger is keeping a link to all my posts on probabilistic range at Baseball Primer. There's a discussion there as well. Posted by StatsGuru at 11:09 AM
| TrackBack (0)
November 12, 2003
Probabilistic Model of Range, Team Positions
Permalink Like Bill James did with defensive win shares, I'm working top down. I started with overall team range, looking at DER compared to predicted DER. Now, I'm breaking each team down by position, so you'll be able to see where each organization has a weakness in range. There are 30 charts below, one for each team: Posted by StatsGuru at 10:24 PM
| TrackBack (0)
More Defensive Regression
Permalink Part II of Michael Humphreys' DRA article is up on Baseball Primer. I have just scanned it at this point, but it looks very interesting, and there are lots of good comments. I'll be commenting more when I've read the post thoroughly. Posted by StatsGuru at 08:41 AM
| TrackBack (0)
November 10, 2003
New Defensive Measures
Permalink I'm not the only one working on new defensive analysis. Michael Humphreys is publishing on Baseball Primer his Defensive Regression Analysis system. It looks very promising. Posted by StatsGuru at 11:31 AM
| TrackBack (0)
November 09, 2003
Final Team Range Calculation
Permalink The final calculation of range is in. What team exceeded expectations more than any other? The Braves:
And although it seemed like the Rangers were the worst defensive team in terms of actual DER, the Mets acutally fell short of expectations by the most. Now that I'm fairly confident of the model, time to start looking at team positions to see where the weak spots are showing. Posted by StatsGuru at 02:17 PM
| TrackBack (0)
Model Comparisons
Permalink The following table is presented to summarize the previous posts using different parameters to calculate range (batted ball, with stadium, with pitcher, with batter, both batter and pitcher). It compares the difference between actual DER and expected DER:
While this table shows that parks in general have a much bigger effect than handedness, batting or pitching side really matters for certain teams. So in my final model, I'm going to build in everything. So we're going to look at the probability of an out given the batted ball type, direction and speed, the stadium, the handedness of the pitcher and the handedness of the batter. Posted by StatsGuru at 11:06 AM
| TrackBack (0)
Probabilistic Model of Range, Batter's Effect
Permalink The previous post looked at the effect of the pitcher's handedness on the probablistic range calculation. We now look at how the handedness of the batter effects that calculation. The following table calculates expected DER based on the batted ball type, direction, speed and the handedness of the batter. I basically substituted batting side for throwing hand in this calculation. The results:
Again, like throwning hand, batting side doesn't make a big difference in order of team compared to just using the batted ball parameters. It also seems that the boost the Dodgers and Athletics got from looking at the handedness of the pitchers is balanced by the decline when you look at the handedness of the opposing batters. To check this, I ran the calculation using both pitcher and batter handedness:
So they don't cancel each other out. I'll summarize the results so far in my next post. Posted by StatsGuru at 09:29 AM
| TrackBack (0)
Probabilistic Model of Range, Pitcher's Effect
Permalink Recently, I looked at the effects of ball parks on range. I was next going to see what ballparks were most different from normal, but I have quite figured out the correct way to do that yet. Instead, I'm looking at handedness today. We'l start out with the handedness of the pitchers. The following table calculates expected DER based on the batted ball type, direction, speed and the throwing hand of the pitcher. I basically substituted throwing hand for ballpark in this calculation. The results:
If you compare the above table to my original calculation (based on the three batted ball features), you see very little difference in the ordering of the teams. Unlike park effects, the handedness of the pitchers have very little to do with the team's DER. Two teams it seems to help are the Dodgers and Athletics, although at the moment I have no speculation why. Posted by StatsGuru at 08:33 AM
| TrackBack (0)
November 05, 2003
Ballparks and Defense
Permalink The next step I'm taking in my probabilistic model of range is to add in the park as a parameter. Here's the new table of predicted and actual defensive efficiency records:
One thing for sure, no matter how you measure it, the Mariners are great and the Yankees are poor. One of the more interesting moves is by the Red Sox. They move up to the middle of the pack from the very bottom when you don't include the park as a parameter. This makes sense, since the green monster makes many balls unfieldable. A very similar move happens with the Twins due to the baggy and the fast artifical turf on which they play. I think the next step is to compare each field with the overall model for the majors to see where in each stadium the biggest differences are. Posted by StatsGuru at 09:40 PM
| TrackBack (0)
November 02, 2003
Probabilistic Model of Range, continued
Permalink I'm starting work again on my probabilistic model of range. (You can read about my previous work here.) These will come in a series of posts that I hope I will be able to gather together into a single paper. The following table is for the complete 2003 season, and is based on the same statistics as my previous output.
I've received a lot of positive feedback about this approach, and some constructive criticism. A number of researchers believe that these figures need to be adjusted for the park and the the handedness of the pitcher. My next step is to make those adjustments and see what happens. Stay tuned. Posted by StatsGuru at 10:07 AM
| TrackBack (0)
October 25, 2003
Jeter Improving?
Permalink Jeter just made a terrific play in the hole. He back-handed Mike Lowell's grounder, spun, jumped and threw Mike out a first, and it wasn't close. I thought for sure it would be a hit. Posted by StatsGuru at 09:01 PM
| TrackBack (0)
October 22, 2003
Nice Play
Permalink I complain a lot about Derek Jeter's defense, but he just made a very nice play on a ball chopped over Clemens' head by Rodriguez. Jeter charged in, got a good hop and fired Pudge out at first. Posted by StatsGuru at 09:35 PM
| TrackBack (0)
October 15, 2003
Center Field Speed
Permalink Soriano just hit one into short center. Watching Damon run after the ball, you can see the difference between him and Williams. Damon would have gotten to Millar's ball. Williams would not have gotten to Soriano's. Posted by StatsGuru at 05:16 PM
| TrackBack (0)
October 14, 2003
Jeter D
Permalink Derek Jeter finally makes a nice play at shortstop. He dove to his left, kept his eye on the ball, made a strong but wide throw to Johnson who tagged the runner. We should see that more often from Derek. Posted by StatsGuru at 06:35 PM
| TrackBack (0)
October 13, 2003
Hideki Rice
Permalink Matsui takes a page out of Jim Rice's playbook, and does a good decoy in left field to make Millar think he was going to catch the ball off the wall. He might have saved a run there. Sox, after an intentional walk, have the bases loaded and Varitek is pinch hitting for Mirabelli. Update: Varitek hits a slow ball to shortstop, and the Yankees fail to turn the double play, although it was close. Then they make another baserunning blunder to end the inning. It's 3-1 Red Sox after 7. Mussina was taken out of the game after the Varitek RBI. He goes 6 2/3, gives up three earned runs and strikes out 10. Posted by StatsGuru at 10:22 PM
| TrackBack (0)
October 09, 2003
Hit it Up the Middle
Permalink First Jeter, now Soriano gets to show he can't play the middle of the infield. The official scorer gave Manny Ramirez a hit on that, but a good second baseman makes that play. The DP looms large now. Posted by StatsGuru at 08:28 PM
| TrackBack (0)
Red Sox-Yankees
Permalink Kapler leads off with an infield single off Pettitte. It was a play in the whole that a great shortstop would have made (or at least, it would have been a close play at first). Jeter didn't get the throw off. Posted by StatsGuru at 08:22 PM
| TrackBack (0)
October 08, 2003
"Off the Glove of Jeter"
Permalink Joe Buck's words as Millar drives in Ramirez. How many balls get by Jeter in the hole before someone realizes he can't play there anymore? Red Sox lead 5-0 in the 7th. Posted by StatsGuru at 10:33 PM
| TrackBack (0)
October 07, 2003
Gonzalez to Gonzalez
Permalink For the second time tonight Alex Gonzalez grounds out to Alex Gonzalez. Posted by StatsGuru at 09:28 PM
| TrackBack (0)
October 05, 2003
Bernie's Arm
Permalink Torii Hunter tagged up and went to 2nd on a fly ball to Bernie Williams in centerfield. Bernie had to relay the ball to Jeter, who almost got Hunter at 2nd. But Williams isn't strong enough to throw the ball in to 2nd on the fly. Dave Justice is being properly crticial of this during the broadcast. It's another reason Bernie should not be in centerfield anymore. Posted by StatsGuru at 04:35 PM
| TrackBack (0)
October 04, 2003
One-way Player
Permalink Chipper Jones is a great hitter, but he can't play defense. They moved him from third because he couldn't handle the hot corner, and now twice today he's shied away from balls near the ivy covered walls of Wrigley that he could have caught. Simon got a double on Jones' timidity, and Damien Miller hits a solid double to left to cut the lead to two. It's 6-4 Braves, with no out, and Lofton representing the tying run. Update: Lofton strikes out for out #1. Because Sosa bats third, he'll probably have a chance to tie or win this game with one swing. Update: Smoltz is going after Sosa with first base open. Sosa has never hit a HR off Smoltz in 41 AB, according to the broadcast. Update: Grudzielanek pops out, it's up to Sosa. Posted by StatsGuru at 08:06 PM
| TrackBack (1)
October 02, 2003
Jeter Error
Permalink Jeter throws away the third out in the 5th innings, bringing up Pettitte nemesis Shannon Stewart. I wonder when some announcer will say that Jeter can't play short any more? Update: Soriano fails to get to a ball up the middle, giving Stewart another hit and putting runners at first and third. The key to beating the Yankees is putting the ball in play up the middle, and the Twins are doing that in this inning with the grounders to the middle infielders. Rivas makes the mistake of grounding to third, and Boone throws him out. This is why Pettitte's eight strikeouts are so important. They are balls that weren't put in play so the defense couldn't botch them. Posted by StatsGuru at 09:41 PM
| TrackBack (0)
September 26, 2003
Range Probability Extended to Positions
Permalink This is the next article in a series on a system I'm developing which I'm calling a probabilistic Model of Range. If you haven't been following the discussion, you should read these posts first: Here is the updated list of range rankings, through Thursday, Sept. 25, 2003. Posted by StatsGuru at 08:45 PM
| TrackBack (0)
September 22, 2003
Range Rankings
Permalink In my original post on the probabilistic model of range, I ranked teams based on the ratio of balls turned into outs to expected outs. I didn't really like that, but again, I was in a hurry on Friday. One of the nice things about long bike rides is that you can think about these things, and I decide what I was really doing was figuring out expected and actual DERs, and I could just rank teams by the difference. So here's the data (updated through yesterday) ranked by difference in DER.
I like this ranking better. It's a good starting point to start looking at individual positions and fielders on a team. Posted by StatsGuru at 10:33 PM
| TrackBack (0)
More on Probability and Range
Permalink Last Friday, I wrote about the beginnings of a probabilistic model of range for fielders. In doing so I neglected to cite the work of Michael Lichtman, leading Michael to make this comment in a thread on Baseball Primer:
I have apologized for my oversite, and Michael has thanked me for that. However, I'd like to disagree that our systems are exactly the same, and point out what I see as the differences. First of all, what Michael deserves credit for is the methodology. He looked at the probability of getting outs in a zone for an average fielder and is comparing that to a given fielder. This is a probabilistic model, although he doesn't state this explicitly. His model is p(o,f|zone), or in English, the probability of an out by a fielder given the zone the ball is hit into. If you look back at my post I state my model as the following:
There's an important difference here. Michael is starting with zone ratings, and putting them in a probabilistic model. I'm starting with a probabilistic model, and I really don't care what the parameters turn out to be, as long as they work. The difference can really be seen in part II of Lichtman's post. Here, he's adjusting for all kinds of different factors. He figures out an adjustment factor (for example, a park effect), then multiplies his original figure by that. In my model, these factors would just be more parameters. No special adjustments are needed. Also, in this work, I'm trying to get rid of any sort of defined zone. In order to decide if a ball is in a zone, you have to know the distance it traveled. But that distance depends on the whether or not a fielder stopped the ball. So two line drives that are similar otherwise will look very different if a fielder catches one but not the other. Does it make a difference? I'm not sure, but the idea of a zone is an artifical construct, and I would rather have it fall out from the parameters of the batted ball than from post-contact factors. One of the other things I never liked about zone ratings (by the way, I worked extensively on the zone rating code when I was at STATS, Inc.) is that they do nothing to rate pitchers and catchers, and Michael kept this feature in his UZR. One reason for this is that zones are hard to define for these fielders. But since this work moves beyond the zone, it's not a problem. We can measure catcher and fielder stats as well as any other position. I consider this a big improvement over zone ratings. Finally, the treatment of errors. STATS and Lichtman treat errors as if they were actually balls on which the fielder recorded an out. I once witnessed a lively discussion between Bill James and John Dewan over this. Bill thought this was wrong, that if you don't make the play you shouldn't get credit for getting to the ball. John disagreed. I did not have strong feelings about this at the time, but I've come down on Bill's side. One nice thing about this, you don't have to make a separate adjustment for the errors, as UZR does. There are just two types of balls, outs and non-outs. It doesn't matter if the non-out is an error or not; the fielder's probability will be lower, and since you would expect the errors to occur on easier balls, the fielder will pay a big penalty for his errors automatically (I have not proved the previous statement, but should be able to see if it's true once the complete system is in place). Michael Lichtman deserves the credit for coming up with the idea of thinking about fielding in terms of probability of balls in a zone. My work has extended that idea and formalized it, making it easier to compute, and extending it to fielders not previously covered. Posted by StatsGuru at 09:01 PM
| TrackBack (0)
September 19, 2003
A probabilistic Model of Range
Permalink Measuring the ability of fielders to turn batted balls into outs is one of the most unyielding areas of baseball research. Part of the problem was that for a long time, we didn't have good information. What we'd like to produce is a number that represents the player's range. Early attempts at this looked at plays per game; as we got defensive innings, we were able to make this plays per 9. But this did not adjust for important elements; how many batters a pitcher strikes out, or the handedness of the staff.
When STATS, Inc. started keeping data, it also collected parameters about the batted ball; its distance, direction, how hard it was hit, the type (ground, fly, etc.) and with that they created Zone Ratings to try to compensate for the unknown information. Zone Ratings gives you credit for all balls a fielder turns into an out, while penalizing them for balls not fielded within their zone. The problem with zone ratings is that all balls in the zone are treated the same. One might imagine that balls hit to the edge of the zone are harder to field than balls hit in the middle of the zone (where you would expect the fielder to position himself). One of the big discoveries of recent years is that pitchers don't seem to effect fielding stats that much. A recent discussion of this can be found in this previous post. Let's just say that the amount a pitcher effects balls in play going for hits is up for discussion. I work at the CIIR at UMass, and our much of our current work involves using probablistic models to understand and retrieve documents (where "document is a very generic term, not limited to text). So I thought, why not apply these to fielding? I'm asking the question, what is the probability of a batted ball becoming an out, given the parameters of that batted ball? I've used the STATS, Inc. database to obtain three parameters for each ball; its direction (a slice of pie fanning out from home plate), its batted type (ground, fly, line, bunt or pop) and how hard the ball was hit (soft, medium or hard). I then did a maximum likelihood estimate of the probability of an out given those three parameters for each of the nine fielders. Mathematically, you might write it p(o,f|d,t,h). Let's look at a specific example. Take a ground ball up the middle to the leftfield side of 2nd base, hit with medium speed. The probability of the batter reaching base is .416. The probability of the pitcher turning it into an out is .312. Shortstop, .258; second base, .013; catcher, .0009 (these may not add up due to rounding). If it were a line drive instead of a ground ball, the probabilities change:
Now, how do we use this information? These probabilities can be thought of as expectations; if a team has 1000 balls hit as line drives to the above direction with medium speed, 25% of them would be turned into outs. So if a team is turning more than 25% of those into outs, they are exceeding expectations. So my first attempt at using this information is to figure out, for each team, how many balls put into play against them should have been turned into at least one out. I'll then compare that to how many they actually turned into outs, and see what teams exceed expectations the most:
I will eventually extend this to each position on the team, then to individual fielders. One think to note, the Phillies do better here than they do in DER. I'm gone until Sunday night, but I hope this gives you something to think about. Enjoy your weekend! Update: I mistakenly did not look for other research in this area. I'll point you to two posts on Baseball Primer by Michael Lichtman for a stat call UZR, or ultimate zone rating. Part I is here, and part II is here. The methodolgy is the same, although I think there are minor differences in the way we treat the data. I have to digest Michael's system a little more, but I'll be commenting on this soon. Correction, 12/23/2003: Corrected a typo. Changed "So my first attempt at using this information is to figure out, for each team, how many balls put into play against them were turned into at least one out. I'll then compare that to how many they actually turned into outs, and see what teams exceed expectations the most:" to "So my first attempt at using this information is to figure out, for each team, how many balls put into play against them should have been turned into at least one out. I'll then compare that to how many they actually turned into outs, and see what teams exceed expectations the most:"' Posted by StatsGuru at 04:15 PM
| TrackBack (1)
September 13, 2003
Defensive Rankings
Permalink Back in June I posted runs created against the defense. Basically, I took the most current runs created formula STATS has, took out stats that are attributable to the pitcher, (HR, BB, HBP, K), and figured runs created per 27 defensive outs. Here's the chart through yesterday:
It looks like the Giants have really improved their defense. They wee ranked 14th in early June, 4th today. The White Sox having a better defense than the Twins was not an anomoly. I think most people would assume the Twins are the better defensive team, but it's just not true. So much for having a great defensive first baseman. The AL East is a waste land. It makes me wonder if these teams have good offenses because they play each other so often. (I just checked, and the Red Sox and Yankees scored higher outside of the division, the Blue Jays score the same in or out). There's lots of room for improvement here. Bernie Williams is 35 today. At this point, I think Matsui is the better centerfielder. It's time to switch the two of them in the outfield. The west coast, on the other hand, is all defense. Five of the top six teams border the Pacific Ocean. I haven't taken park effects into account, so that may be helping these teams. I welcome any comments on this stat. Posted by StatsGuru at 09:31 AM
| TrackBack (0)
September 09, 2003
Hunting Crede
Permalink I just saw Torii Hunter make a bad play. Joe Crede hit a ball to deep center, to the warning track. Hunter went back, reached out, but appear to shy away from the ball at the last minute and it dropped for a double. It scored a run, and moved a runner to third who then scored on a sac fly. It would have been a good play if Hunter had made it, but it's the kind of ball you expect a good CF to catch. White Sox lead 2-0. Posted by StatsGuru at 08:50 PM
| TrackBack (0)
August 14, 2003
Great Play
Permalink I don't get much of a chance to write about good defense on the Yankees, but Matsui just made a fantastic catch. With a one run lead, two on and two out Bigbi hits one the opposite way, deep. Matsui sprinted toward the left field corner and warning track, reached out, caught the ball, and crashed into the wall. He hung on, looked dazed, but ended the inning. Posted by StatsGuru at 10:00 PM
| TrackBack (0)
August 10, 2003
UTP
Permalink It figures. I take the dog out and I miss an unassisted triple play! Congrats to Furcal. You don't see those very often. Update: As Jon Miller just pointed out, the HD picture gave you a much better view of the triple play. There have been a couple of times that I noticed the HD picture was giving you a better view of the defense. You can see more defenders moving at once, so you get a better idea of what's going on. Posted by StatsGuru at 09:38 PM
| TrackBack (2)
August 08, 2003
Ichiro!
Permalink More good defense in this game. Ichiro makes a catch sliding on his behind in shallow right center. Amazing body control and hand-eye coordination. Posted by StatsGuru at 09:41 PM
| TrackBack (0)
D.D's Defense
Permalink David Dellucci, with the bases loaded and two out, makes a terrific catch to end the inning. In RF, Delllucci had to run far to his left, nearly to the foul line, to make a diving catch of a Ben Davis pop. Jeff Weaver owes him a dinner for that one. (The runs would have been Weaver's; the ball was hit off Hitchcock.) Posted by StatsGuru at 08:43 PM
| TrackBack (0)
Nice Play
Permalink With all the criticism I give the Yankees middle infielders, Soriano just made a nice play to save a run. With a man on third and the infield in, Soriano dove to his right to knock down a ball, froze the runner at third and threw out the batter. The Yankees get out of the inning as McLemore flies out to right. It's 1-0 Seattle in the 2nd. Posted by StatsGuru at 07:38 PM
| TrackBack (0)
Jeter's Disbelief
Permalink Darren Viola points out this article by Eli Saslow of the Newark Star-Ledger. It's about math professor Michael Hoban and his quest to devise a formula that rated shortstops. What surprised Hoban was that his formula rated Jeter the worst defender: Jeter doesn't believe it. "I'm the worst?" Jeter said when confronted with the numbers. "I don't think I would say that. But I couldn't really care less what some mathematical equation comes out with." Later, Jeter makes an intelligent argument:
Now, Jeter has a point with the strikeouts. And from the way the article describes the formula, I don't trust it that much myself. For example, the most heavily weighted factor is fielding percentage, and frankly, MLB shortstop fielding percentages are not all that different. What gets Jeter in the formula is his range, and range will be effected by the handedness of the pitchers on your team and their propensity for strikeouts. But these have been adjusted for. In looking at this article, I wondered if Hoban had read Win Shares. That formula does take into account all of the things Jeter was refering to in his point about strikeouts. Here's Jeter's win shares per 162 games by year: Posted by StatsGuru at 09:42 AM
| TrackBack (0)
July 23, 2003
Using His Defense
Permalink Mark Redman is throwing a two-hitter, despite striking out only 1. The Marlins don't have a great defense (they have the third worst DER in the NL). I guess the Braves are hitting everything right at somebody. Posted by StatsGuru at 08:52 PM
| TrackBack (0)
June 30, 2003
Calloway Arm
Permalink While watching the Expos-Mets, I just saw Ron Calloway almost make a terrific play. Burnitz smoked one into deep right field. Calloway ran back and to his left to try to make the play, but the ball was just beyond his glove. The ball bounced off the wall, and Calloway barehanded it turned and threw a strike in the air to second base. Burnitz only beat the throw barely. Calloway showed a Guerrero like arm on that play. Posted by StatsGuru at 08:51 PM
| TrackBack (0)
June 10, 2003
Is It Me?
Permalink I just turned on the Yankees game to watch the top of the fifth. First batter, Berkman, hits a slow roller between 1st and 2nd. Soriano runs over, dives ... and totally misses the ball. Then Hidalgo hits a soft line drive that Jeter jumps for ... and it goes off his glove. They did then turn a DP, but I see fielders make both those plays all the time. In all fairness, in the bottom of the fifth, Kent bobbled a double play ball and could only get Jeter at first, leaving Soriano at 2nd rather than getting out of the inning. The Giambi had an RBI single and Posada a HR, so this time, the opposition made the costly mistake. Posted by StatsGuru at 08:32 PM
| TrackBack (0)
June 09, 2003
Measuring Defense
I was trying to find another way to calculate defense other than using defensive efficiency. I decided to look at runs created against the defense. So I use the runs created formula, but don't use HR, walks, HBP and strikeouts. Here's the result:
Permalink
Posted by StatsGuru at 10:01 PM
| TrackBack (3)
Yankees Defense
Permalink How often are we going to read this?
And those two runs made the difference in an 8-7 Cubs win. Posted by StatsGuru at 07:17 AM
| TrackBack (0)
June 03, 2003
Pettitte Push
Permalink For the 2nd game in a row, the Yankees defense has prevented their starter from getting a win. Pettitte leaves with the score 3-3. He should be leading 3-2. Posted by StatsGuru at 09:31 PM
| TrackBack (0)
Excuses, Excuses
Permalink I'm sorry to keep harping on this. I'm watching the Yankees-Reds, and Pettitte retires the first 10 batters. Sean Casey comes up, and hits a wicked line drive at Soriano. Now, I was never much of a fielder, but I remember they taught me to get in front of the ball. Soriano moves away from the ball and tries to field it by sticking out his glove. Of course, it goes by Soriano for a base hit. Kaat and O'Neill make the excuse that it's a hard hit ball and Soriano can't be expected to give up his body for it. Huh? That's exactly what Soriano should do. If it hits him in the chest, he throws the guy out. Then of course, Griffey singles, runners on first on third, then on an easy DP ball, Soriano makes a bad throw, pulls Jeter off the bag, and Jeter can't make the throw to first in time. Tie game. Soriano gets the DP on the next batter, but where Pettitte should have a shutout, he gives up a run on shoddy defense. Posted by StatsGuru at 08:14 PM
| TrackBack (0)
May 17, 2003
Yankees Defense
Permalink Andy Pettitte's defense has cost him today. Errors by Ventura and Matsui have led to three unearned runs. While the Yankees fielding percentage isn't bad, the Yankees rank behind only Texas in defensive efficiency, the ability to turn a batted ball into an out. Two third of all batted balls (not counting HR) are allowed to fall for hits. It's a good thing their pitchers strike out as many as they do to cover this weakness. Posted by StatsGuru at 02:39 PM
| TrackBack (0)
May 01, 2003
Catchers Defense
Permalink Steve Amamoto writes concerning my post about Yorvit Torrealba: Catcher's defense encompasses many things. Ivan Rodriguez has a great arm, but he's not known as a catcher who calls a good game. If you shut down the running game, but your pitch calling causes a lot of baserunners to reach base, you haven't done your job. You can't pick one part of the catcher's game and say he's a good defensive catcher. You have to look at the totality. Posted by StatsGuru at 09:03 PM
| TrackBack (0)
April 26, 2003
Backup Catcher
Permalink Doug Purdie writes in response to this post:
Thanks, Doug! Posted by StatsGuru at 12:20 PM
| TrackBack (0)
April 24, 2003
Everett's Error
Permalink It seems somehow appropriate that Boston's first run today comes as a result of a Carl Everett error. Posted by StatsGuru at 02:25 PM
| TrackBack (0)
Yankees Defense
Permalink Steve Bonner writes:
Good question, Steve. The defensive stat I like best is DER, that measures how often a ball put into play against a defense is turned into an out. I commented on how the Yankees have a poor DER a few days ago. At that time, it was .647. They have since brought it up to .665, so their defense has been better lately. But that still isn't that good. So yes, the Yankees defense can hurt them down the road. But there are two mitigating circumstances:
Yes, the defense and bullpen is weak. But the offense and starting pitching is so strong, those weaknesses are easily covered up. Sure, they can hurt them in the post-season; in a short series weaknesses can be easily magnified. But I would expect the Yankees to address the bullpen if it continues to be an issue, and I think the offense is good enough (especially if Jeter returns and Giambi starts to hit) to cover the weak defense. Posted by StatsGuru at 01:38 PM
| TrackBack (0)
April 19, 2003
Indian Errors
Permalink The Cleveland Indians repeated their four error performance of opening day against the White Sox this afternoon. The errors led to seven unearned runs. The Indians had only one 4-error game all last year. Posted by StatsGuru at 06:07 PM
| TrackBack (0)
April 18, 2003
Defensive Efficiency
Permalink An interesting matchup in the Yankees-Twins game. Defensive Efficiency measures the ability of a defense to turn a ball in play (other than HRs) into an out. The Twins lead the majors with a mark of .757 (or, 76% of balls put into play against them are turned into outs). The Yankees have the worst DER at .647. That means that for every 100 balls put into play against these two clubs, the Twins will get 11 more outs. That's almost four innings worth of outs. The Yankee pitchers make up for this somewhat by walking few batters and allowing few HR. But the Twins have a 3.22 ERA, and the Yankees a 3.35 ERA. Of course, after this discourse, Soriano leads off with a HR! Posted by StatsGuru at 08:10 PM
| TrackBack (0)
April 15, 2003
Twins D
Permalink The Minnesota Twins have a DER of .759. That's 20 points higher than any other team. That means the Twin get about 7 more innings of outs from 1000 balls in play than any other team. No wonder their pitchers have only allowed a .214 BA. Here's a piece I wrote last year about using defensive efficiency, which helps explain the stat. It's from May 26th, 2002. Posted by StatsGuru at 01:57 PM
| TrackBack (0)
April 13, 2003
Astro Errors
Permalink Once again, errors are the difference in the game. The Astros made two errors leading to five unearned runs. If those errors are not committed, the Astros probably win by 2. Posted by StatsGuru at 05:54 PM
| TrackBack (0)
Throwing Game
Permalink Al Martin got throw out stealing in the first inning of the Yankees game. He's the fifth runner the Yankees have thrown out this year in 6 tries. That's the best CS% in the majors. Update: Travis Lee led off the 2nd with a walk. After a strikeout, Lee tried stealing and got caught. The Rays are now 1 of 5 stealing against the Yankees this year. Do you think Piniella will figure out that this strategy doesn't work against this team? Posted by StatsGuru at 01:21 PM
| TrackBack (0)
April 12, 2003
To Err Is Human
Permalink Craig Stambaugh points out that after yesterday's post, the Pirates made two errors in the Cubs game today and lost. Kerry Wood also had something to do with it, as he struck out 13 and only allowed 3 hits. Posted by StatsGuru at 09:07 PM
| TrackBack (0)
April 11, 2003
It's All Relaford
Permalink Shane Spencer might have just cost the Indians a chance to tie this game. He went for a triple with none out in the top of the ninth, and Desi Relaford threw him out at third from right field. The Royals win, 1-0 and are now 8-0. According to Bill James, they'll only win 58 more games this year. :-) Posted by StatsGuru at 09:30 PM
| TrackBack (0)
Nip and Tucker
Permalink Michael Tucker just made a great running catch for the Royals. John McDonald lauched a ball to deep left center, and Tucker on the full run got his glove up and had the ball settle right in. Made it look easy. The KC Royals have the 2nd best defensive efficiency record in the majors. Catches like that are a reason why. (Defensive efficiency is the percent of balls in play that are turned into outs. If you have a good DER, your pitchers can afford to have more balls put into play against them. If your team has a low DER, you better have a staff that can strike out a lot of batters.) Posted by StatsGuru at 07:45 PM
| TrackBack (0)
Errors
Permalink Once difference in the Pirates-Cubs game today is that the Cubs made an error and the Pirates didn't. That error led to an unearned run, which proved to be the margin of victory. I once saw a stat about team winning percentages when making at least 1 error, and teams that did so had a very poor winning percentage. This year so far, teams that make at least 1 error in a game are 67-75, a .472 winning percentage. Teams that don't make an error in a game are 70-62, a .530 winning percentage. Posted by StatsGuru at 06:33 PM
| TrackBack (0)
April 06, 2003
Unearned Runs
Permalink The Reds allowed three unearned runs in the Cubs four run first. That's 8 unearned runs the Reds have allowed in 6 games. That's creating more work for their pitchers, and for their offense. Posted by StatsGuru at 01:36 PM
| TrackBack (0)
April 05, 2003
Trading Defense
Permalink Bernie Williams and Travis Lee robbed each other. In the bottom of the third, Lee hit a high fly ball to deep center. Bernie ran back to the wall, and doing his best Willie Mays, caught the ball over his shoulder as he crashed into the dead centerfield barrier. In the top of the fourth, Bernie came up and hit a hard grounder right inside the first base line. Lee dived to his left to snare the ball, then tossed to an alert Joe Kennedy covering to take away an extra-base hit from Williams. It's 2-1 Devil Rays after 4. Posted by StatsGuru at 07:23 PM
| TrackBack (0)
April 03, 2003
Cabrera's Cannon
Permalink Great play by Orlando Cabrera. Marcus Giles hit one up the middle. Cabrera dove for the grounder to stop it, then threw from his knees to nail Giles. Expos lead 4-0. So far, the Braves have scored 2 runs vs. the Expos. Is it the Braves offense or the Expos pitching? I might suggest it's the Expos defense. As I'm listening to Skip Caray, he's talking about all the great defensive plays the Expos have made in this series. Expos pitchers have only struck out 13 in the three game through 8 innings tonight. So a lot of balls have been put in play. None have gone out of the park (good pitching), but the Braves were only batting .215 coming into the game. That's probably the defense. We'll see how this holds up against other opponents. Update: Cabrera made another great play stopping a grounder up the middle to end the game. According to the broadcast, it's the first time the Braves were shutout in consecutive games since 1992. Posted by StatsGuru at 10:12 PM
| TrackBack (0)
April 01, 2003
Unusual Play
Permalink You don't see this too often. Barajas on 2nd for the DBacks, Womack hits a hard ground ball to the 2nd baseman Cora, who fires to third to get Barajas trying to advance. A great play, but costly if it fails. Posted by StatsGuru at 09:17 PM
| TrackBack (0)
March 31, 2003
Red Sox Defense
Permalink If Sox fans were worried about Todd Walker's defense, he's ended the first two innings with excellent defensive plays. Posted by StatsGuru at 05:53 PM
| TrackBack (0)
DRays Fielding
Permalink I'm watching the Red Sox at Devil Rays right now. Red Sox have scored first, mostly because of two poor fielding plays by the 2nd and 3rd baseman. Posted by StatsGuru at 05:28 PM
| TrackBack (0)
March 30, 2003
Valentine
Permalink I was starting to think Valentine might not be too bad after his fight analysis (it's not a problem), but then he started talking about great defensive teams. While I don't disagree with his picks, his argument was that they had great first basemen! Please, Bobby, it's nice to have a great glove at first base, but if the shortstop and second basemen can't reach the ball, the first baseman isn't going to have a lot to do. Posted by StatsGuru at 07:21 PM
| TrackBack (0)
March 28, 2003
Yankees Defense
Permalink Dan McLaughlin of the Baseball Crank pens this article on BaseballPrimer.com about the defense of the Yankees during the Stengel era. A great piece of work, read the whole thing. Posted by StatsGuru at 10:54 AM
| TrackBack (0)
|
Navigation
EMail
Home About the Author Dedication Baseball Musings Radio Show Sporting News Columns Day by Day Database Lineup Analysis Defensive Charts, Probabilistic Model of Range Syndicate this site:  Full post feed: Robot Podcast Feed Terms of Service Mitchell & Ness Throwback Jerseys View blog authority
Tickets and Other Links
Buy MLB Baseball tickets online including Boston Red Sox tickets, New York Yankees tickets, Baltimore Orioles tickets, Chicago Cubs tickets, San Francisco Giants tickets, Washington Nationals tickets, Los Angles Dodgers tickets, Florida Marlins tickets. San Diego Padres tickets, Cardinals box seats and premium astros tickets. We also carry concert tickets and theater tickets.
MLB Baseball Baltimore Orioles Tickets Boston Red Sox Tickets Chicago Cubs Tickets Chicago White Sox Tickets Houston Astros Tickets LA Dodgers Tickets New York Yankees Tickets Washington Nationals Tickets and St Louis Cardinals Tickets GET ME IN! is the leading marketplace for: Sports Tickets Football Tickets Rugby Union Tickets Rugby League Tickets Hong Kong Sevens Tickets MotoGP Tickets Grand Prix Tickets NBA Tickets NFL Tickets Theatre Tickets and Concert Tickets Ticketamerica.com MLB Tickets Chicago Cubs Cincinnati Reds Houston Astros Milwaukee Brewers Pittsburgh Pirates St. Louis Cardinals Boston Red Sox New York Yankees Tampa Bay Devil Rays Premiership football tickets FA cup tickets Champions league tickets Football tickets Olympics tickets Super Media Blog
Calendar
Recent Entries
New RSS Feed
New Look Coming Team Offense, Arizona Diamondbacks Lastings Impression Pledge Drive Update Long Term Lester Stadium Pictures Lugo and Lowrie Pledge Drive Update Team Offense, Pittsburgh Pirates
Search
Archives
By Category:
Advertising (10) Agents (12) All-Star Game (173) All-Time Greats (239) Army Strong (8) Attendance (174) Authors (3) Awards (169) Base Running (78) Baseball (1581) Baseball Jerks (219) Blogs (759) Books (129) Broadcasts (568) Charity (49) Cheating (665) Collectibles (15) College (1) Colleges (3) Commissioner (40) Conditioning (1) Contests (10) Crime (100) Cuba (1) Deaths (169) Defense (372) Demographics (8) Discipline (12) Division Races (724) Draft (63) Equipment (25) Fan Rant (46) Fan Violence (10) Fans (58) Fantasy Baseball (38) Feats (3) Films (3) Free Agents (782) Games (5549) History (102) Hit Streaks (22) Humor (64) Ice Cream (4) Illnesses (135) Independent Leagues (16) Infrastructure (3) Injuries (1122) International (76) Interviews (168) League Championship Series (1170) League Division Series (923) Little League (2) Management (1281) Mascots (4) Matchups (698) Mechandising (46) Minor Leagues (12) Movies (9) News Media (96) Oddities (1) Offense (216) Old Timers (4) On Base (18) Opening Day (210) Opening Day Impressions (19) Other (321) Owners (73) Pennant Races (32) Pitchers (2911) Players (1524) Podcasts (185) Post Season (59) Power Hitting (5) Pranks (1) Predictions (145) Probabilistic Model of Range (108) Public Relations (8) Records (153) Rivals (2) Rookies (44) Rules (25) Salaries (12) Scheduling (22) Science (1) Scoring (5) Series (61) Simulations (5) Sluggers (752) Spring Training (117) Stadiums (279) Standings (25) Statistics (996) steroids (1) Strategy (171) Streaks (14) Superstitions (16) Team Evaluation (937) Team Movements (58) Tickets (56) Trades (700) Transactions (321) Umpires (53) Uniforms (17) Union (22) Welcome! (3) women (4) World Cup (170) World Series (657) By Month: March 2009 February 2009 January 2009 December 2008 November 2008 October 2008 September 2008 August 2008 July 2008 June 2008 May 2008 April 2008 March 2008 February 2008 January 2008 December 2007 November 2007 October 2007 September 2007 August 2007 July 2007 June 2007 May 2007 April 2007 March 2007 February 2007 January 2007 December 2006 November 2006 October 2006 September 2006 August 2006 July 2006 June 2006 May 2006 April 2006 March 2006 February 2006 January 2006 December 2005 November 2005 October 2005 September 2005 August 2005 July 2005 June 2005 May 2005 April 2005 March 2005 February 2005 January 2005 December 2004 November 2004 October 2004 September 2004 August 2004 July 2004 June 2004 May 2004 April 2004 March 2004 February 2004 January 2004 December 2003 November 2003 October 2003 September 2003 August 2003 July 2003 June 2003 May 2003 April 2003 March 2003 February 2003 January 2003 December 2002 November 2002 October 2002 September 2002 August 2002 July 2002 June 2002 May 2002 April 2002 March 2002
Credits


|
||||||||||||||||||||||||||||||||||||||||||||||||||||||||||||||||||||||||||||||||||||||||||||||||||||||||||||||||||||||||||||||||||||||||||||||||||||||||||||||||||||||||||||||||||||||||||||||||||||||||||||||||||||||||||||||||||||||||||||||||||||||||||||||||||||||||||||||||||||||||||||||||||||||||||||||||||||||||||||||||||||||||||||||||||||||||||||||||||||||||||||||||||||||||||||||||||||||||||||||||||||||||||||||||||||||||||||||||||||||||||||||||||||||||||||||||||||||||||||||||||||||||||||||||||||||||||||||||||||||||||||||||||||||||||||||||||||||||||||||||||||||||||||||||||||||||||||||||||||||||||||||||||||||||||||||||||||||||||||||||||||||||||||||||||||||||||||||||||||||||||||||||||||||||||||||||||||||||||||||||||||||||||||||||||||||||||||||||||||||||||||||||||||||||||||||||||||||||||||||||||||||||||||||||||||||||||||||||||||||||||||||||||||||||||||||||||||||||||||||||||||||||||||||||||||||||||||||||||||||||||||||||||||||||||||||||||||||||||||||||||||||||||||||||||||||||||||||||||||||