 |
 |
|
| |||||||||||||||||||||||||||||||||||||||||||||||||||||||||||||||||||||||||||||||||||||||||||||||||||||||||||||||||||||||||||||||||||||||||||||||||||||||||||||||||||||||||||||||||||||||||||||||||||||||||||||||||||||||||||||||||||||||||||||||||||||||||||||||||||||||||||||||||||||||||||||||||||||||||||||||||||||||||||||||||||||||||||||||||||||||||||||||||||||||||||||||||||||||||||||||||||||||||||||||||||||||||||||||||||||||||||||||||||||||||||||||||||||||||||||||||||||||||||||||||||||||||||||||||||||||||||||||||||||||||||||||||||||||||||||||||||||||||||||||||||||||||||||||||||||||||||||||||||||||||||||||||||||||||||||||||||||||||||||||||||||||||||||||||||||||||||||||||||||||||||||||||||||||
|
March 10, 2009
The Eck
Permalink Nationals hitting coach Rick Eckstein appears to be making progress with Adam Dunn and Austin Kearns. He made changes to move Kearns back to how he was hitting when he came up. If Eckstein can get Zimmerman, Johnson, Dunn and Kearns to all improve, the Washington offense might not be too bad. Posted by StatsGuru at 12:11 PM
| Comments (0)
| TrackBack (0)
January 29, 2009
Looking A's
Permalink Athletics Nation takes an indepth look at the A's propensity to strikeout looking. The team does rank high in the stat, but more interesting are the player charts. There are players like Sweeney and Crosby who get called on the edges, but there are also players like Cust and Hannahan who just takes hittable pitches. Posted by StatsGuru at 05:27 PM
| Comments (0)
| TrackBack (0)
January 25, 2009
Rocky Road
Permalink Via Purple Row, Bay Bridge Baseball does some interesting research on Matt Holliday: The point to all this is that you can't just take Matt Holliday's career splits (.357 at Coors Field and .281 on the road) and say: "Well, he's really a .281 hitter." That .281 average is the sum of a lot of games in which Holliday was trying to get acclimated to sea-level pitching. In theory, if you took Holliday (or any Colorado hitter) and put him at sea level all the time, he'd be a much better hitter than he was wearing the Rockies' road grays. Using the Day by Day Database, Jeff Fletcher shows that Holliday gets better the longer he spends on the road. I would not have expected that. After all, athletes train at high altitude so they can perform better at oxygen rich lower elevations. I would think after spending 10 days playing in Denver, a hitter's bat would be a little quicker playing at sea level in Los Angeles or San Diego. Fletcher's implication is that hitters should be better on the road when they're not playing for the Rockies than when they sit on the Colorado roster. The following table lists batting averages for players with at least 600 AB on the road while playing for the Rockies and at least 600 at bats on the road for other teams:
There's not much support for the adjustment theory in this data, although we should probably study a few more players on a game by game basis. Posted by StatsGuru at 03:08 PM
| Comments (10)
| TrackBack (0)
January 21, 2009
The Right Improvement
Permalink Jeff Francoeur is spending the winter working on his hitting: What makes him think things will be so different? Changes he made this offseason to his stance. After nonstop tinkering last summer, Francoeur has locked into one approach he thinks will work. Using some advice and video recommended by former Braves Mark DeRosa and Mark Teixeira, Francoeur adopted a more balanced position at the plate, with his hands farther back and a shorter stride. He's been working it into his muscle memory, hitting four times a week since Nov. 15. Okay, but where are the pitch recognition drills? There's no doubt Francoeur can crush a ball in the strike zone, but the opposition knows there's no reason to throw a pitch over the plate to Jeff. Until he learns to wait for his pitch, he'll be a limited offensive player. Posted by StatsGuru at 08:50 AM
| Comments (3)
| TrackBack (0)
January 11, 2009
How Many Runs?
Permalink Joe Posnanski comes up with a new use for the Lineup Analysis tool. *According to the Baseball Musings Lineup Analysis -- one of my favorite toys -- a whole team of 2008 Adam Dunns would average 6.67 runs per game -- so that's 1,080 runs per season. Not only is it an honor to appear in a Pozerisk, but I also get a new nickname, the Musinator. That joins Pintometer, the name they called me in the ESPN research department. Posted by StatsGuru at 01:17 PM
| Comments (6)
| TrackBack (0)
December 31, 2008
Seat of Power
Permalink Beyond the Boxscore looks at the best pitch locations to hit for power looking at the axis perpendicular to the direction of the ball (inside/outside). As you might imagine, players hit for more power on inside pitches than outside pitches, but balls over the heart of the plate deliver the most damage. Posted by StatsGuru at 09:14 AM
| Comments (1)
| TrackBack (0)
Estimating the Reds
Permalink Red Reporter uses the Lineup Analysis Tool to estimate the number of runs the Reds will score in 2009. The results aren't pretty. Posted by StatsGuru at 09:01 AM
| Comments (0)
| TrackBack (0)
September 30, 2008
Better Coach
Permalink Mickey Hatcher praises Mark Teixeira for teaching the Angels to be more selective. Too bad Mickey, the hitting coach, couldn't do that. Posted by StatsGuru at 09:46 PM
| Comments (1)
| TrackBack (0)
September 10, 2008
Chipper Back
Permalink Chipper Jones is back in the batting race. His three for four tonight makes him eight for his last 14 and raises his batting average to .363. Pujols is 1 for 3 so far tonight, batting .360. Can anyone remember the last time we had a batting race this tight with averages this high? The Baves with 9-5. Posted by StatsGuru at 10:26 PM
| Comments (3)
| TrackBack (0)
September 01, 2008
Quote of the Day
Permalink First off, if your #2 hitter lays down a sacrifice bunt in the first inning -- as Luis Rodriguez did on Friday night -- then you probably need to find another #2 hitter. Posted by StatsGuru at 01:12 PM
| Comments (3)
| TrackBack (0)
August 14, 2008
Looking for Runs
Permalink A good pitching duel between Andy Sonnanstine and Justin Duchscherer ended when Ben Zobrist doubled home the go-ahead run in the seventh Wednesday night as the Rays maintain their lead in the AL East with a 3-2 win over the Athletics. Oakland continues to sputter offensively. This was the 20th game in their last 26 in which they scored three runs or less. Looking at the individual hitters, you can find something positive to say only about Cust, Suzuki and Brown, but none of them are great. The overall numbers are absolutely dreadful. An individual player hitting .218/.289/.318 is waiting for a ticket to the minor leagues. The batters have almost 40 more strikeouts than hits, and almost three times as many strikeouts as walks. To turn the Ks around, opposition pitchers are striking out 8.5 per nine against the Athletics in this stretch. There's no way an offense can be successful when they can't put the ball in play often enough. Maybe it's time for the whole team to start choking up on the bat. Posted by StatsGuru at 08:23 AM
| Comments (1)
| TrackBack (0)
June 29, 2008
Low Scoring Sunday
Permalink So far, the Cardinals/Royals game stands out as the high scoring contest of the day. St. Louis took that game by a score of 9-6, beating out the battle of Ohio by one run. However, in the first fourteen games finished today, the teams scored just 94 runs, or 6.7 per game. Six game finished with five runs or less total, and the Rangers lead the Phillies 3-1 in the eighth. We'll see if the Chicago teams can bring the average up. Update: The Rangers win 5-1 bringing the total for the day to 100 runs and leaving the average at 6.7. Ian Kinsler went 3 for 4 today with a triple. At age 26, he's coming into his own as a player. He currently sports a .377 OBA and a .534 slugging percentage. The White Sox just took a 1-0 lead in the bottom of the fourth on a Carlos Quentin home run. He came into the game with his power waning in June (.435 slugging percentage this month through the 28th), but that home run ties him with Josh Hamilton for the AL lead in home runs. Update: The White Sox sweep the Cubs at US Cellular Field, taking the last game 5-1. That's 106 runs in 16 games, or 6.6 runs per game today. Correction: Sorry, there were 15 games played yesterday, not 16. That makes 7.1 runs per game. Posted by StatsGuru at 08:27 PM
| Comments (2)
| TrackBack (0)
June 26, 2008
Shake Your Lineup
Permalink Charlie Manuel shook up the Phillies lineup Wednesday night to try to break a slump that saw Philadelphia score just eleven runs in a six-game losing streak. Utley and Burrell moved up, Rollins and Howard moved down, and the offense showed a little life. Chase went four for four, missing the cycle by a homer. However, he neither scored nor drove in a run. Coste knocked in two as the Phillies went on to a 4-0 win over the Athletics. Kyle Kendrick contributed more, as he pitched eight shutout innings. It was easily his best outing of the season, as he walked just one batter and struck out four. We'll see if Manuel sticks with this lineup, or if it was just a shock to wake up the team. Posted by StatsGuru at 08:08 AM
| Comments (0)
| TrackBack (0)
June 22, 2008
How Offense Should Work
Permalink Cito Gaston won his first game in his new stint as Blue Jays manager as Toronto defeated Pittsburgh 8-5. The table setters reached base six times, and the heart of the order drove in five runs. Rios and Overbay each hit a double, and number six hitter Scott Rolen homered. It's only the second time in their last 12 games that the Blue Jays scored more than four runs. Posted by StatsGuru at 06:39 PM
| Comments (0)
| TrackBack (0)
June 01, 2008
Nats Naughts
Permalink Chico Harlan looks at the recent poor performance of the Washington Nationals offense. Of course, the problem is bigger than two shutouts in a row. The Nationals have the lowest OPS in the National League. Imagine a team made up of hitters like Casey Blake and Gary Matthews, Jr., and you have the Nats. Posted by StatsGuru at 09:57 PM
| Comments (2)
| TrackBack (0)
May 29, 2008
Blue Jays Breakout
Permalink The Blue Jays are pounding the Athletics this afternoon, off to a 10-0 lead in the sixth inning. It the first time the Jays reached double digits in runs in a game since April 15th when they scored eleven against Baltimore. Six of the starters collected multi-hit games so far. Litsch is making another good start, walking just one through 5 2/3 innings, and keeping the ball in the park. Posted by StatsGuru at 05:37 PM
| Comments (1)
| TrackBack (0)
May 22, 2008
What Happened to the Indians Hitters?
Permalink Mark Buehrle came into the game against the Indians having allowed a .318 batting average on the season. The Indians, however, could manage just two hits against the lefty. They lose 3-1, wasting an excellent effort by Laffey. With only one run tonight, the Indians fall below 4.0 runs per game for 2008. With six straight losses and eight straight Chicago wins, Cleveland is now 4 1/2 games back in the AL Central. You also have to wonder if Wedge is moving onto the managerial hot seat with Yost and Randolph. Posted by StatsGuru at 11:54 PM
| Comments (1)
| TrackBack (0)
May 19, 2008
Interleague Weekend
Permalink Correction: I figured the runs per game off the pitching file, which means I was looking at the other league. That caused me to report the runs backward. The table above is fixed now. I've rewritten the post to reflect this. The scoring pattern did not hold over the weekend, with the American League teams outscoring the National League teams.
The American League won the weekend 22-19. There were fifteen one-run games this weekend, and the AL won those as well 8-7. The National League scored more with designated hitters, although the AL difference remains larger. Also, this really isn't a good comparison until all teams have played with and without the extra hitter:
So the NL took their home series 13-11, while the AL won at home 11-6, in line with the run differences. Posted by StatsGuru at 08:12 AM
| Comments (3)
| TrackBack (0)
Hot Hitters
Permalink Take a look at the latest hit streaks. Of the top eleven streaks, five hitters are hitting .500 or better during the streak. Only Hunter Pence is hitting under .400. Usually, when I look at this list, you see a couple of people with weak streaks; one hit a game, a batting average under .300. This group is pounding the ball, however. Posted by StatsGuru at 07:49 AM
| Comments (1)
| TrackBack (0)
May 16, 2008
The DH Difference
Permalink I was just looking at runs per game in interleague games with and without the designated hitter, and found this amazing number:
So the designated hitter is worth 1/2 run to the American League, but the NL teams do better with a pitcher! That's how poor a bench the NL has carried over the first eleven years of interleague play. Posted by StatsGuru at 08:11 PM
| Comments (3)
| TrackBack (0)
The Interleague Test
Permalink With fourteen interleague games today we'll get a test of the relative strength of the two leagues. Here's how offenses look through intraleague play on Thursday:
My theory is that the NL is better because they developed better, younger batters. Some in the comments here have suggested the NL is better because the AL owns better pitchers. Others suggested the AL recently incorporated more glove men into their lineup. How can we tell? The situation is of course, complicated. All of these factors might be true. If AL pitchers are better than NL pitchers, and there really is no difference in batters, then we should see AL scoring rise and NL scoring fall, adjusting for the DH (or lack thereof). If NL batters are truly better than AL batters, then we should see AL runs allowed s rise, and NL allowed fall on a per game basis. There's also the possibility that AL pitchers are better than NL pitchers, and AL batters are worse than NL batters. This is a tough case, because we might not see any change here at all as things even out. The possibility exists of AL pitchers and batters being better than NL pitchers and batters. In that case, the AL pitchers should be greatly superior, since they are holding better batters to fewer runs. In that case, we should see AL scoring go up and NL scoring go down. That would be a very strange result. This weekend won't be enough to tell, since teams might be pitted against an opponent that is good at neutralizing the other's strength. That won't stop us from at least taking a look at how things turned out on Monday. Posted by StatsGuru at 08:09 AM
| Comments (1)
| TrackBack (0)
May 15, 2008
Lower Order Pirates
Permalink The six, seven and eight slots for the Pirates haven't produced much this season. Coming into today, they produced .240, .230 and .212 batting averages, with OPS of .734, .663 and .541 respectively. Today, however, they keyed the Pirates win. The three batters in the slot combined to go 8 for 13 with two walks and a double. They made all those times on base count as they scored eight of the Pirates eleven runs. They take two out of three from St. Louis are find themselves tied with the Brewers for fourth in the NL Central. Posted by StatsGuru at 05:32 PM
| Comments (0)
| TrackBack (0)
May 14, 2008
Home Runs and Temperature II
Permalink Earlier today I linked to a post at Sabernomics looking at temperatures in April to see if they contributed to the fall off in home runs. My good friends at STATS, Inc. were able to supply me with the actual game time average temperatures for the same period. Here's the outdoor stadiums only:
While the average US temperature in April was lower than in 2007, at baseball games it was higher. However, this data does show a big falloff over the last two Aprils. Posted by StatsGuru at 10:19 PM
| Comments (1)
| TrackBack (0)
Different Offenses
Permalink My latest column at SportingNews.com examines the different paths the Marlins and Athletics followed to generate runs. Posted by StatsGuru at 05:00 PM
| Comments (0)
| TrackBack (0)
Home Runs and Temperature
Permalink Sabernomics compares the home run rate in April over the last decade to the temperature in April. The last two season, home runs are down and so is the temperature. The temperature he uses, however, is mean US temperature. I'd like to see someone use actual game time temperature to do the same study. Posted by StatsGuru at 11:24 AM
| Comments (1)
| TrackBack (0)
May 13, 2008
Scoring More
Permalink William Burke and Joe Sheehan try to tackle the puzzling question of why the AL is scoring less than the NL, in what appears to be an article available to everyone. My SportingNews.com column looked at this last week, with Burke and Sheehan commenting: I'm not entirely convinced, but he lays out an interesting case. These two researchers dig deep into the number and present evidence that fewer fly balls are leaving the park in the AL this year, leading to a large reduction in slugging percentage. However, I'm not convinced as to their why: I think there may be some selection effects happening here. I've written about this when it comes to playoff baseball. Playoff games are generally lower scoring than regular-season games. However, part of the reason for that is that managers play as if they will be lower scoring, using more one-run strategies than they normally would and emphasizing defense to a greater extent. It becomes, if not a self-fulfilling prophecy, one that gets helped along. The only place I can see where a team truly traded slugging for defense was at shortstop in Baltimore. Asdrubal Cabrera sparked the Indians offensively last season. The Royals didn't exactly have offensive power houses at shortstop before Pena. Torii Hunter stayed in the AL. The Tigers moved their great defensive third baseman to the bench for more offense. The Yankees play Giambi at first to improve their outfield defense, but they still keep all those hitters in the game. Maybe if you look over a few season it's there, but I don't see it. I notice a lot of old Firstbase/DH types not producing. Posted by StatsGuru at 05:17 PM
| Comments (1)
| TrackBack (0)
May 11, 2008
Keeping Track of the Order
Permalink A rare batting out of order took place in the Reds/Mets game today: Backup catcher David Ross came to the plate to lead off the inning and lined out. But the batter in the No. 8 spot should have been outfielder Corey Patterson, with Ross hitting ninth after an earlier double switch. When I wrote the game scoring code for STATS, coding this took a bit of doing. For example, Randolph might have decided he didn't want Ross batting again, and Patterson would be skipped. So I had to code in a skip batter event, which given the right situation, a scorer might have to skip everyone in the lineup to get back to the proper batting slot. Posted by StatsGuru at 07:32 PM
| Comments (0)
| TrackBack (0)
Shortstop Streak
Permalink Jeff Keppinger keeps hitting. He's two for two today to give him hits in seven straight at bats. Six were singles, but he picked up a triple this afternoon. The Reds trail the Mets 6-3 in the bottom of the sixth. Posted by StatsGuru at 03:11 PM
| Comments (1)
| TrackBack (0)
May 09, 2008
Low Scoring Friday
Permalink It's been an incredibly low scoring night. The Tigers have scored six runs against the Yankees, but no other team scored more than three so far. Of the early games, two are 1-0 and one in 0-0. We'll see how the late ones work out. Posted by StatsGuru at 08:51 PM
| Comments (0)
| TrackBack (0)
May 07, 2008
Shift in Dominance
Permalink My latest column at SportingNews.com examines why the National League is outscoring the American League so far this season. I really believe this is the first indication of a seismic shift in the quality of the leagues. It happened twice before. The NL was way ahead of the AL in signing black ballplayers after Jackie Robinson broke the color barrier, and that led to the NL dominating the All-Star game from the 1950s through the early 1980s. Then, the AL was quicker to harvest the talent coming out of Latin America, and AL became the dominant league, taking over the All Star game from the late 1980s through last season. It now appears that the NL discovered that young talent is better talent, and I suspect they will once again return to being the dominant league. Posted by StatsGuru at 11:55 AM
| Comments (9)
| TrackBack (0)
April 30, 2008
Here Comes the Sun
Permalink Earlier in the day, Devon Young emailed: In day games, the Pirates are scoring 5.7 rpg (40 runs in 7 games) ~ but at night, they're averaging 3.9 rpg. That's a huge split. It's a small sample size, but then the Pirates score seven runs in the second inning. Five were unearned, but Perez was wild, walking five in the game and didn't get out of the second inning. The Pirates are making the seven runs hold up as they still lead 7-0 in the top of the fourth. Posted by StatsGuru at 03:01 PM
| Comments (2)
| TrackBack (0)
April 29, 2008
Selectivity Stats
Permalink FanGraphs presents some very cool numbers on batter plate discipline. I'm not surprised to see Frank Thomas at the top of the leader board for lowest percentage of swings at balls outside the zone, nor am I surprised to see Vlad Guerrero with the second highest percentage in that category. There are lots of ways to be successful in baseball. Posted by StatsGuru at 03:45 PM
| Comments (2)
| TrackBack (0)
April 24, 2008
Ramping up the Runs
Permalink With the Tigers scoring thirty seven runs in their last three games, they're now averaging 5.2 runs per game. That's still less than I expected, but a few more games like this and they'll be close to six per game. They defeat Texas 8-2. Posted by StatsGuru at 06:23 PM
| Comments (0)
| TrackBack (0)
April 23, 2008
Barry Pujols
Permalink Teams are walking Albert Pujols at every opportunity, and it's causing Albert to change his approach at the plate for the worse: After leading in the count 3-0 against Guillermo Mota, Pujols took a strike, then swung at two low pitches to strike out for only the seventh time this season. "I felt I didn't want to walk, and I took myself out of the strike zone to swing at that pitch," Pujols said. "The 3-0 pitch was a little low. But I tried to push too much. I should've taken my walk. It's something you learn. You press. It's the way the game goes." Albert needs to take the Bonds approach. The walks are good, the walks help his team. There will be times when the opposition can't walk him, and then he needs to wait for his pitch. That's what made him such a great hitter this decade. There's no reason to change just because teams are pitching around him. The more he gets on base, the more the Cardinals score. Posted by StatsGuru at 07:47 AM
| Comments (3)
| TrackBack (0)
April 14, 2008
Flood Gates Open
Permalink We knew the Tigers offense was good, but after yesterday's shutout, the Tigers were losing 5-0 going to the bottom of the sixth. Then they started hitting. The scored four in the sixth, but gave them back in the top of the seventh. They scored one more in the seventh, then hit the Twins bullpen for six in the eighth. Sheffield, Ordonez, Cabrera and Guillen are a combined 10 for 17 tonight, each with at least two hits. They lead 11-9 in the top of the ninth. This could be the spark the offense needed. They've increased their runs scored by 33% tonight. Update: Jones puts two runners on base but holds on for the save. A huge win for the Tigers, and a tough day for the Twins pitching staff which was performing very well up to this point. Posted by StatsGuru at 10:21 PM
| Comments (1)
| TrackBack (0)
April 06, 2008
GDP Tigers
Permalink The Tigers hit into five ground ball double plays tonight, nearly doubling their total for the season. They're tied with the Twins for most GDP in the majors this season. The Tigers really suffered from Murphy's law in this game. Verland pitched badly, and his defense didn't help him as five of the nine runs he allowed were unearned. The White Sox, on the other hand, received good pitching, and showed selectivity at the plate as they drew six walks to go with their twelve hits. The Tiger fans were booing tonight, and as the game progressed their home team just gave them more reasons to keep the cat calls coming. They ended the game appropriately, hitting into a double play with the bases loaded. Posted by StatsGuru at 10:58 PM
| Comments (0)
| TrackBack (0)
April 03, 2008
Timing Off
Permalink It's early, but runs are down from last season. Through three days of the season (it really starts on Monday):
More home runs, but fewer men on base. There's been about one fewer hit+walk+HBP per game this season, leading to a drop in OBA from .330 to .323. Would that be enough to cause a one-run drop in scoring? What's really happened is that players aren't delivering with runners in scoring position. At this time last year, the majors were hitting .266/.355/.369 (BA/OBA/Slug) with runners in scoring position. This year, .247/.350/.381. That's about a 20 point drop in batting average in a situation where batting average does a lot of good. The power is up, but the hits are less frequent. The low scoring so far is a failure of timing. Posted by StatsGuru at 07:44 AM
| Comments (3)
| TrackBack (0)
April 02, 2008
Can't Buy a Run
Permalink The Giants haven't scored in 15 innings, and the Astros haven't scored in 14. I know a some point they'll score runs, but you have to start wondering when. Update: Bourn draws a walk with the bases loaded, and the Astros break their streak in the sixth inning. They trail San Diego 2-1 with the bases still loaded. Posted by StatsGuru at 12:01 AM
| Comments (5)
| TrackBack (0)
February 26, 2008
Fixing Reyes
Permalink The Mets are trying to get Jose Reyes out of the habits he picked up at the end of last season. That leads to this being a bad thing: Jose Reyes swore he was just trying to hit a line drive up the middle, or even to the opposite field, as instructed. Yet with a flick of his wrists he hit a screaming shot that crashed high off the 20-foot fence in center field, 408 feet from the plate. I've seen something similar happen to Soriano. In his last year with the Yankees he hit a couple of home runs on low, outside pitches, then chased that pitch for the rest of the year. Posted by StatsGuru at 07:43 AM
| Comments (1)
| TrackBack (0)
December 12, 2007
AL Offenses
Permalink My latest column at SportingNews.com examines if the moves made by the Tigers are enough to move them ahead of the Yankees offensively. Posted by StatsGuru at 02:30 PM
| Comments (1)
| TrackBack (0)
November 15, 2007
Sinister Reasons
Permalink The Hardball Times looks at position bias as a major explanation for the advantage of left-handed batters over right-handed batters. Posted by StatsGuru at 11:25 AM
| Comments (9)
| TrackBack (0)
September 11, 2007
High Scoring Day
Permalink So far four teams have scored at least thirteen runs today. The Rangers defeated the Tigers this afternoon 13-6, the Red Sox are up 16-9 on the Devil Rays, Florida took Washington 13-8 and the Braves defeated the Mets 13-5. That makes the Angels offense look week as they only managed ten runs against the Orioles! In the history of the Day by Day Database (back to 1957), there was a day with six thirteen-runs games, June 9, 1999. Four such contests tie for second in that time period. It also happened earlier this season on July 29, 2007. Posted by StatsGuru at 10:45 PM
| Comments (2)
| TrackBack (0)
September 09, 2007
Pulling Pitches
Permalink I thought ESPN missed a great chance at analysis in the top of the fifth inning in tonight's Indians-Angels game. Sizemore leads off the inning, pulling a double to right field, not down the line, but to the left of the rightfielder. Cabrera follows up with a double he pulls into the gap deep in right-center. The interesting thing to me is that K-Zone showed both pitches away from the batter. Sizemore's was about 3/4 to the outside edge of the plate, and Cabrera made contact with the ball over the outside edge of the plate. I always hear announcers say how you should go with pitches away, but here were two cases when pulling the ball more outside than inside resulted in long hits. I'd love to hear Joe's explanation for that. Posted by StatsGuru at 09:48 PM
| Comments (7)
| TrackBack (0)
August 30, 2007
Historic Low
Permalink As mentioned in the previous post, the Padres have the highest run differential in the National League, +67. That struck me as a very low number for this far into the season, and indeed it is. The following table lists the best run difference in the National League from 1962 to the present, the era of the 162 game schedule.
The Padres are on a pace for a +82 run difference this season, which would just beat out 1982. Even strike years higher than 2007. And this is the problem with parity. It's nice to have lots of teams involved in a playoff race, but it would also be nice to have some good teams as well. There's no inspiring team in the National League this season, no one that's going to get a chapter in the history books. There are just teams that can win on any given day, or just as easily lose. The good news for an owner who really wants to win is that it should be too difficult. If you're willing to do what the Marlins did in 1997, and spend money on quality free agents, dominating the NL in 2008 should be a piece of cake. The teams just aren't that good. Posted by StatsGuru at 08:23 AM
| Comments (8)
| TrackBack (0)
August 11, 2007
Offensive Machine
Permalink The Yankees send ten men to the plate in the second inning, collecting a walk and six hits, the last a home run off the bat of Alex Rodriguez. That gives Alex 112 RBI and 105 runs scored in 114 games played. He going to need a very good finish to get both more runs and RBI than games played. They score seven times in inning and lead Cleveland 7-1 in the second. With Mussina on the mound, however, one wonders if that lead is safe. Posted by StatsGuru at 07:52 PM
| Comments (1)
| TrackBack (0)
Western Woes
Permalink The Dodgers and Padres each lost this afternoon, scoring one and three runs respectively. That's been pretty much the problem during Arizona's surge. Since 7/21, the Diamondbacks are scoring 5.2 runs per game. The Padres are 1/2 run back at 4.7, and the Dodgers are bringing up the back of the pack at 3.4. That's worst in the NL over that time. A win tonight opens up Arizona's lead in the division to four games over the Padres and six games over the Dodgers. Posted by StatsGuru at 07:34 PM
| Comments (0)
| TrackBack (0)
July 18, 2007
Phillies Phive
Permalink
The Phillies cruised to an easy win last night, defeating the Dodgers 15-3. Seven players managed multiple hit games, including pitcher J.D. Durbin who collected three hits. The biggest nights belonged to Shane Victorino and Aaron Rowand, each knocking out five hits in the game. Ryan Howard hit a pair of two-run home runs. Shane Victorino tied a career high with five hits. Aaron Rowand set a career high with five hits. Chase Utley collected three RBIs. Pat Burrell hit his 200th career homer in the seventh inning. In the fifty seven year history of the Day by Day Database, it's just the eighteenth time two players on the same team picked up five hits in the same game. With his two home runs last night, Howard has hit fifteen in his last 155 at bats, about one every ten at bats. That's better than his career average of one every 11.4 at bats. Photo credt: Jordan Murph/Icon SMI Posted by StatsGuru at 08:53 AM
| Comments (2)
| TrackBack (0)
July 07, 2007
Still Not Scoring
Permalink Despite yesterday's big scores, offense remains down vs. 2006. Through the same number of days:
Major league OBA is down to .332 in 2007 after coming in at .337 in 2006. It's pretty much in line with the decade, however. Posted by StatsGuru at 08:29 AM
| Comments (0)
| TrackBack (0)
July 06, 2007
Power Twins
Permalink The day is not over, but the Twins scored 32 runs on the day so far. In the night cap, they've hit six home runs, three by Morneau. They have the bases loaded with one out in the top of the eighth with a 12-0 lead. They've already scored the most runs in one day in the last 50 years. The St. Louis Cardinals scored 28 on 9/7/1993, the biggest one day total in the 51 seasons covered by the Day by Day Database. The AL record for runs by a team in a double header is 36, but the Twins fail to score in the top of the eighth. Of top of the great offense, Matt Garza turns in six shutout innings, extending his streak of scoreless innings from his two relief innings earlier this week. He struck out six as well. Correction: I had forgotten to sort the query result. The Cardinals, not the Braves had the biggest one day total in the last 51 seasons. The Braves, Astros, Orioles and Athletics all had days with 27 runs in that time frame. Correction: The box score I looked at last night had this wrong. Morneau hit three home runs, Cuddyer one. Posted by StatsGuru at 10:47 PM
| Comments (2)
| TrackBack (0)
July 04, 2007
Offensive Difference
Permalink All eight position starters in the Cubs lineup today come into the game with an OBA at or above the league average of .328. Only one Nationals player can say that, Dmitri Young. Update: Zimmerman, however, provides some power as his two-out solo home run puts the Nationals up 1-0 in the bottom of the first. Posted by StatsGuru at 12:15 PM
| Comments (0)
| TrackBack (0)
June 06, 2007
Old Hitters
Permalink For Baseball Prospectus subscribers, my latest article is now available. This week I look at how hitters are getting older, and how GMs and managers on average do a good job with older hitters. Posted by StatsGuru at 01:16 PM
| Comments (0)
| TrackBack (0)
May 28, 2007
Mariners Bats
Permalink The Seattle Times notes the Mariners offensive rise in the AL: After all, they just spent the past week receiving the equivalent of a collective cortisone shot. Three games each against Tampa Bay and Kansas City have not only soothed a once-hurting offense, but boosted it into a powerhouse with the American League's highest batting average. Seattle ranks sixth in the American League in runs per game at 4.85, exceeding their runs created projection. That's more in line with their .331 OBA, which is 8th in the AL and their seventh ranked slugging percentage. In a low offensive year, the Mariners are doing okay. Seattle unintentionally adopted the Angels playbook. They aren't walking much, but their not striking out, either. With 210, they have the fewest strikeouts in the AL. They're putting the ball in play a lot, and good things are happening. Posted by StatsGuru at 09:14 AM
| Comments (1)
| TrackBack (0)
May 25, 2007
Where are the Runs?
Permalink Runs are down over .5 per game for May 2007 vs. May 2006, through May 24 (9.67 in 2006 vs. 9.13 in 2007). I checked with my good friends at STATS, Inc. and they tell me that the temperature difference between May 2006 and May 2007 is slight. Last year, the average temperature in May for games was 70.1 degrees Fahrenheit (with or without dome stadiums). This year, it's 69.9 degrees Fahrenheit. That doesn't seem like much of a difference to me. The weather looked like a good reason in April for the decline. It's looking like less of a good reason in May. Posted by StatsGuru at 10:33 AM
| Comments (10)
| TrackBack (0)
May 23, 2007
Swing at Anything
Permalink Seth Kolloen blasts the Mariners for becoming less selective at the plate, despite the coaching staff trying to turn them around: OK, so the Mariners aren't patient. So what? Sure, they've got the fewest walks in the major leagues, but they also have the fewest strikeouts. The team batting average is .269! What's the problem? Here's the problem: Patience isn't just about earning walks, it's about driving up the pitch counts of opposing starters, seeing them off to the showers, and pummeling the squishy belly of every team's pitching staff -- the middle relief. I'll just add that if you can lay off balls out of the strike zone, you're more likely to get pitches in the strike zone you can crush. Seth lays the blame at the feet of the GM, since he's the one who acquired this type of player. The whole article is well worth the read. Posted by StatsGuru at 08:54 AM
| Comments (1)
| TrackBack (0)
May 17, 2007
No Offense Thursday
Permalink As of 1:41 PM EDT, there have been 32 half innings played. The eight teams in action have combined for 14 hits and one run. Posted by StatsGuru at 01:41 PM
| Comments (1)
| TrackBack (0)
May 13, 2007
Low Runs
Permalink Offense is 2007 continues to lag behind offense in 2006. Over the last week, the gap started to widen again. Right now, total runs per game is about 0.7 runs lower than through he same point last year. Here's a graph of each individual day over the two seasons (click on graph for a full size view):
As you can see, most of the difference resulted from low scoring early in the season, giving credence to the weather explanation. At the end of April (around Day 27) things start to even out, and 2007 looks a lot like 2006. But lately scoring diverged again. The weather's been nice in the northeast lately, but I know a lot of rain fell on other parts of the country. Unfortunately, I don't have weather data, so I'll leave that to other researchers. Note, also, that in 2006 up to this point there were twelve days in which the league averaged eleven runs per game or better, and only one this season. In contrast, six games in 2007 fell at or below seven runs per game, while there was just one in 2006. Also note that early in the season you can pick out the days the #1 starters pitched, and the days the #5 starters pitched. After two weeks, these get jumbled enough that the volatility in runs per game goes down. Which is another reason the recent week of 2007 is interesting, the volatility went back up. I'm not totally convinced the weather is the only factor at work here. The weather is improving, but runs per game are starting to get worse again. The current blip down is too short a time frame to be meaningful, but it bears watching. Posted by StatsGuru at 09:02 AM
| Comments (2)
| TrackBack (0)
May 07, 2007
K-Fish
Permalink Another example of why strikeouts don't seem to matter that much to an offense. Posted by StatsGuru at 03:29 PM
| Comments (1)
| TrackBack (0)
May 06, 2007
Power Spectrum
Permalink J.J. Hardy picked up two hits last night, including his eighth home run. That raised his slugging percentage to .610, best when hitting as a shortstop. He's not the only shortstop off to a big power surge to start 2007. Seven major league shortstops are slugging above .500 right now. There are a number of reasons this is remarkable:
Whom do you pick on your all-star ballot? Posted by StatsGuru at 09:07 AM
| Comments (1)
| TrackBack (0)
May 05, 2007
Cardinals and Contact
Permalink In the discussion about the White Sox hitters this morning, the Cardinals turned out to be the second worst team in batting average when not striking out. They're doing a good job this afternoon of demonstrating why. Through five innings against Albers, they've only struck out twice, but in their other 15 at bats, they've garnered just two hits. The Cardinals trail Houston 9-0 in the top of the sixth. Houston picked up eleven hits in twenty one at bats in which they didn't strike out. Posted by StatsGuru at 02:50 PM
| Comments (0)
| TrackBack (0)
May 02, 2007
Low Scoring Afternoon
Permalink The Dodgers just finished their game with the Diamondbacks, winning 2-1. That completes the afternoon schedule (you had me at hello), and the six game saw a total of 34 runs, 5.67 per game. The weather seems pretty nice right now, and we're still 0.5 runs behind last season. Posted by StatsGuru at 06:01 PM
| Comments (0)
| TrackBack (0)
April 23, 2007
Peak Players
Permalink Sabernomics points to a couple of studies that show hitters peak closer to 29 than 27. That's very interesting. When I first read Bill James and his research that players peaked at 27, it made sense to me. A few years earlier, a crew coach told me that oarsmen peaked at 27. I figured at that point, athletic peak was athletic peak. But it appears Bill's study was biased by the era of ballplayer he chose. Time to readjust my thinking. Posted by StatsGuru at 04:59 PM
| Comments (0)
| TrackBack (0)
Let Them Bat!
Permalink The Diamondbacks pitchers are hitting for a higher batting average than the Diamondbacks pinch hitters. Pitchers are 7/40, a .175 BA, while pinch hitters went 6/37, .162. It should be noted that batters in a pinch drew two walks and were hit by a pitch, giving them a better OBA. They've also produced a double versus no extra-base hits for the pitchers. Still, there's not much of a difference there. With Livan Hernandez 3 for 9, you might as well let him bat for himself. Posted by StatsGuru at 12:26 PM
| Comments (1)
| TrackBack (0)
Top of the Order Division
Permalink Four of the five NL East teams do a fantastic job of setting the table:
Reyes and Rollins each discovered their inner selectivity this year. Jose's OBA is over 100 points better than his career average, while Rollins is up over 40. All these teams are giving their power hitting hearts plenty of RBI opportunities. NY, Florida and Atlanta are in the top five in the NL in runs per game. Posted by StatsGuru at 08:07 AM
| Comments (0)
| TrackBack (0)
April 21, 2007
Wisdom from the Hawk
Permalink Ken Harrelson said something very interesting while watching Crede face Zumaya. Joel is hitting 100 on the gun, and Crede just takes a pitch down the middle. Hawk says that when someone is throwing that fast, it's good to take a pitch like that all the way, not moving your head. He explained that this makes the pitch look slower; it lets the batter time the fastball. Crede then singled in the tying run. I've never heard about this approach to a hard thrower before. Does anyone care to comment? Posted by StatsGuru at 03:06 PM
| Comments (3)
| TrackBack (0)
April 16, 2007
Offense Still Low
Permalink Offense is still down vs. last year, but the gap narrowed a bit over the weekend. Note that MLB is way behind in games played due to all the bad weather:
Here's a list of slugging percentage trailers. Look at the number of big names in the bottom 40. Gary Sheffield, Manny Ramirez, Mark Teixeira, Ryan Zimmerman, Carlos Delgado, Lance Berkman, Frank Thomas and Ken Griffey all make an appearance. And if you keep going, you see more big names that are slugging under .400. I would expect most of the people listed above to end up with pretty good seasons. What we may be seeing is simply a collective slump by some of the big guns. Posted by StatsGuru at 10:52 AM
| Comments (4)
| TrackBack (0)
April 15, 2007
Sizemore Scoring
Permalink Grady Sizemore doubles and scores in the first inning to put the Indians on top 1-0. The hit raises his OBA to .500, and give Grady 11 runs in 9 games. In the last 50 years, only one player posted a season with more runs scored than games played (at least 100 games played), Rickey Henderson in 1985. Right now four other players also have more runs scored than games played, but given their places at the top of the order, Reyes, Rollins and Sizemore are the most likely to make a run at this. (The other two are A-Rod and Abreu.) Sizemore's better career OBA, however, may mean he's the most likely among those three. Posted by StatsGuru at 01:25 PM
| Comments (0)
| TrackBack (0)
April 13, 2007
Is Age the Problem?
Permalink Earlier today I noted the falloff in offense. I've been wondering if age has anything to do with it. In 2005, batting age was at the highest level since World War II. After a couple of years going down, it's jumped again. Age is measured as average age per plate appearance. So it matters who you play, not who is on the roster (click on the chart for a larger image).
The average batting age in 2007 is 29.6 years. So the average hitter is playing past his peak. It may not be a huge factor, but it's something else to consider when evaluating what's going on. Posted by StatsGuru at 03:41 PM
| Comments (1)
| TrackBack (0)
Offensive Falloff
Permalink Runs per game are way down this season over the previous year. So far it's huge:
Some attribute this to the cold weather, but the problem with that is runs are down in lots of ballparks where the weather is nice. While the biggest drop is at PNC in Pittsburgh, where the weather was brutal, Anaheim, Minnesota, Oakland, Toronto, Arizona, Atlanta, Miami, Houston, Los Angeles, San Francisco and San Diego all saw big declines. I'm still blaming small sample sizes, but the weather isn't anywhere near the whole reason. Update: I wonder if the climate controlled balls are making the difference? Posted by StatsGuru at 08:11 AM
| Comments (10)
| TrackBack (0)
April 08, 2007
Taking Rangers
Permalink Evan Grant notices the selectivity of the Rangers hitters: The game-time temperature was 38 degrees, the coldest in the park's 13-plus seasons, and it only turned colder as the night wore on. Had the Rangers not eventually lashed out 14 hits, you might have suspected they weren't swinging for fear of stinging their hands. So far, they're drawing a good number of walks, making their OBA 100 points higher than their team batting average. They just need to raise their batting average from a Mendoza like .203. Posted by StatsGuru at 12:39 PM
| Comments (0)
| TrackBack (0)
The On Base Brothers
Permalink Marcus and Brian Giles reached base six times in nine plate appearances against Colorado last night. Because of them, the 1-2 slots in the San Diego lineup combined for a .444 OBA so far in 2007, the best in the National League. Here's the top five for the major leagues:
(I'm somewhat surprised the White Sox are there with Podsednik and Erstad at the top of the order.) The strange thing, however, is that while they're getting on, they're not scoring. The two combined for six runs so far. Overall, San Diego is hitting fine with men on base and runners in scoring position, but they've gotten little production out of the four and five holes. So if the number three hitter doesn't drive them in, they remain ducks on the pond. Posted by StatsGuru at 09:15 AM
| Comments (0)
| TrackBack (0)
April 03, 2007
Bradbury in the Times
Permalink J.C. Bradbury publishes an opinion piece in the New York Times on how expansion caused the offensive boom of the last decade plus. My comments on the original blog post are here. There's a lot of reason for the spike in offense. Expansion, homer friendly parks and new training regimens would have gotten us most of the way there without PEDs. Posted by StatsGuru at 08:27 AM
| Comments (2)
| TrackBack (0)
March 27, 2007
I-Lead
Permalink Jim Leyland named Ivan Rodriguez the Tigers leadoff man vs. lefties. "I'll hit anywhere I am in the lineup. It doesn't matter," said Rodriguez, a career .304 hitter. "I don't care where I hit, as long as I'm in the lineup every day." I always wonder why players complain about where they hit in the batting order. It seems to me the approach should be the same wherever one bats, get on base. This actually looks like a good move, as over the last seven seasons I-Rod posted a .390 OBA vs. left handers. And, because he won't be leading off every day, there will be less wear and tear on his body, especially in home games. Posted by StatsGuru at 11:06 AM
| Comments (4)
| TrackBack (0)
March 26, 2007
Highs and Lows
Permalink Paul Sullivan discusses the problems the Cubs face moving from Arizona to Chicago, and the chilling effects on hitting. So while Cubs hitters have looked relatively sharp this spring, the turn of the calendar from March to April can lead to a sudden change of direction. While Sullivan is most concerned about the weather, there is also the elevation effect. Phoenix is 1100 feet above sea level, Chicago, 580 feet. The higher you go, the better the ball travels. Posted by StatsGuru at 08:35 AM
| Comments (3)
| TrackBack (0)
March 25, 2007
Worried About the Offense
Permalink Joe Strauss notes the Cardinals lack of hitting this spring. Part of it is the weather: La Russa has been grading on a curve because of the wind blowing into Roger Dean Stadium. But there's more to it as well: Kennedy is representative of a trend this spring. He is one of five projected opening day starters who have missed games because of injury. Shortstop David Eckstein, center fielder Jim Edmonds, right fielder Juan Encarnacion and most recently catcher Yadier Molina are the others. Edmonds is scheduled to play his first game Sunday. Encarnacion may not play in Florida before opening the season on the disabled list with lingering weakness in his left wrist. For years the Cardinals wrote three superb offensive players into the middle of their lineup, so they were able to fill in the gaps with older players. But now, 2/3 of that heart of the order isn't quite as fearsome, so the older players filling St. Louis hired might not be enough. Young offensive talent produced by the St. Louis system since Pujols' premier is close to zero. That lack of production may catch up with the Cardinals this season. Posted by StatsGuru at 07:47 AM
| Comments (1)
| TrackBack (0)
March 23, 2007
Week Leader
Permalink I'm on the road today working from my phone so I can't link, but go to jsonline.com and read the Rickey Weeks story. It's a good example of a misconception about leadoff hitters. It's good for them to be aggressive on a 2-0 court. There job is to get on base. If they take pitches, all the better, but that's not the main part of the job. Update: I'm home, and here's the link. Posted by StatsGuru at 02:13 PM
| Comments (1)
| TrackBack (0)
March 21, 2007
Dunn Slappin'
Permalink Adam Dunn is using Ichiro as a role model. "This is how I'm going to beat that overshift they put on me during the season," said Dunn. Redleg Nation doesn't like the idea. I don't know whether to laugh hysterically at this article, or to weep. Adam Dunn says he wants to start hitting just like Ichiro, and Reds management acts like that is exactly what they want. Redleg Nation is being a bit too pessimistic here. Dunn faded badly at the end of 2006. Who's to say he didn't get into bad habits? If he's trying to do a better job of meeting the ball, that's great. Given his good eye for the strike zone and his strength, doing a better job of making contact would lead to very good results. As long as he's not trying to hit pitches in the dirt, I don't have a big problem with this approach. It seems more like a training exercise than a totally different philosophy. Posted by StatsGuru at 12:40 PM
| Comments (1)
| TrackBack (0)
February 26, 2007
Under Pressure
Permalink John Hawks reviews some research on choking. This last bit reminded me of A-Rod: Well, anyway, it seems clear that people really don't think as well under pressure, which is its own kind of distractor. And those little questions that give rise to self-doubt are some of the most powerful distractors, because they interfere with the process they reference. Posted by StatsGuru at 03:28 PM
| Comments (0)
| TrackBack (0)
February 22, 2007
Long Battles
Permalink Nice research over at the Detroit Tigers Weblog on long battles between batters and pitchers after the count reaches two strikes. Long battles improve the chance of the batter reaching base. Of course, there could be selection bias here. Batters who can foul off or take pitches with two strikes are just better hitters. Posted by StatsGuru at 02:06 PM
| Comments (1)
| TrackBack (0)
February 09, 2007
Schmidt and Strikeouts
Permalink Mike Schmidt takes aim at Pat Burrell and Adam Dunn over their strikeouts. He also criticizes himself: "I don't know Adam Dunn, but from watching I'd say I don't know that a strikeout is as much a slap in the face as it was when I played," said Schmidt, the keynote speaker at Thursday morning's Leadership Breakfast at the Mandalay Banquet Center. "Or maybe I shouldn't have despised the strikeout as much as I did. You get three swats at a guy and there is no reason to strike out as much as I did. We know that putting the ball in play gives a player a decent chance of reaching base. If Dunn followed Schmidt's advice and cut his strikeouts by 100 per season, he would be looking at 30 extra times on base. However, I do disagree with this: What they are doing now is not great, it is mediocrity." Over the last three seasons, Dunn posted win shares of 29, 25 and 18. Burrell posted 14, 24, 15. That's not mediocre. The fear for the two is that as they age, and they can't swing as hard, the ability to overcome the lack of contact decreases. So as their strength decline Schmidt's advice might keep them in the majors longer. Balls, Sticks and Stuff looks at this graphically, and indeed as Schmidt aged, he put the ball in play more. Posted by StatsGuru at 08:42 AM
| Comments (10)
| TrackBack (0)
February 06, 2007
Outfield Worries
Permalink Balls, Sticks and Stuff worries a bit about the Phillies outfield offense: The first thing that your eye is drawn to is just how much the offense is going to depend on Chase Utley and Ryan Howard. The second thing you notice is how much below the league average Victorino is in right field. There's no doubt he'll get to more balls hit to right field than the average right fielder, but we shouldn't fool ourselves into thinking it is going to come close to making up for the deficit in offense. It's Pat's age. At 30, he's going to be downgraded as he's more likely to decline that improve at this point. Posted by StatsGuru at 08:41 AM
| Comments (2)
| TrackBack (0)
November 14, 2006
The Manufacturers
Permalink Balls, Sticks and Stuff looks compares overall run scoring to Bill James Manufactured Runs (MR) measure in The Bill James Handbook 2007 As it turns out, there is a moderate inverse correlation between the percentage of runs a team scores by "manufacturing" and the number of runs the team scores overall. There was a slight difference among leagues: the correlation across all of baseball was -0.573, -0.633 in the American League, and -0.502 in the National League. This makes perfect sense. Teams tend to use one-run strategies when their offense isn't that good (see the comment on Ozzie Guillen here). But also, James counts two types of MRs. Type ones are runs that are intentionally manufactured; they results from steals and bunts, for example. Type II result from less direct means, like having a batter single, moving him up with two ground outs and scoring on a wild pitch. And teams that score like that often aren't good offenses, as their productive outs don't eat away at the team's OBA. Posted by StatsGuru at 08:51 AM
| Comments (0)
| TrackBack (0)
September 07, 2006
The Essence of Comedy
Permalink Shawn Green took some advice to help him hit those two home runs yesterday: Shawn Green was in the batting cage in Houston last week trying to find the power stroke he used to hit 192 home runs between 1998 and 2002, when teammates Carlos Delgado and Julio Franco and Mets hitting coach Rick Down approached him with some strange advice - start tapping his toes. Not only have the Mets put together a very talented team, they appear to be very well coached. Posted by StatsGuru at 08:33 AM
| Comments (0)
| TrackBack (0)
August 27, 2006
Setters and Cleaners
Permalink Johnny Damon and Derek Jeter accounted for the first two runs of the Yankees/Angels game as Damon doubled and Jeter homered in the top of the first. The Yankees 1-2 hitters have now scored 206 runs, the most by any AL team (the Phillies have 214 runs from the top of their order). They've also driven in 161 runs, the most in the majors. So not only do they do great job of setting up the heart of the order, they also drive in the bottom of the order as well. Posted by StatsGuru at 04:19 PM
| Comments (0)
| TrackBack (0)
August 04, 2006
Driving In Runs
Permalink Timothy Moreland take RBI Percentage to the next level. Posted by StatsGuru at 05:45 PM
| Comments (3)
| TrackBack (0)
Driving In Runs
Permalink Timothy Moreland take RBI Percentage to the next level. Posted by StatsGuru at 05:45 PM
| Comments (3)
| TrackBack (0)
June 28, 2006
Mauer Mania
Permalink Joe Mauer went 2 for 3 today to raise his batting average to .392. People are asking can a catcher win a batting title. Maybe we should be asking if a catcher can hit .400. One advantage Mauer will have in going for .400 is that as a catcher, he gets days off. This lowers his number of plate appearances, making it easier for him to get lucky and hit .400. It's easier to hit .400 in 500 at bats than in 600. There's a 1.1% chance of a .350 hitter achieveing a .400 batting average in 500 at bats, a 0.6% chance of it happening in 600 at bats. The Twins win again, defeating the Dodgers 6-3. Santana threw up seven shutout innings, allowing two hits and striking out nine. Liriano and Santana are turning into quite a 1-2 punch. Posted by StatsGuru at 05:17 PM
| Comments (2)
| TrackBack (0)
June 20, 2006
Quadruple Double
Permalink Mark Teixeira hit his 24th double of the year tonight and came around to score to give Texas an early 1-0 lead. The double belongs to the Texas offense this year as Mathews and Young are tied for second with 25, Teixeira is fourth with 24 and DeRosa is 5th with 21. Posted by StatsGuru at 08:37 PM
| Comments (0)
| TrackBack (0)
June 18, 2006
Depending on Your Pitchers
Permalink The Indians scored six runs in their first two games against the Brewers. Half of those runs were driven in by the starting pitchers, Sabathia and Westbrook. Posted by StatsGuru at 09:45 AM
| Comments (0)
| TrackBack (0)
June 17, 2006
The Three Quarter Cycle
Permalink The single, double, home run combination appears to be popular tonight. As mentioned in the previous post, Ibanez put that together for Seattle. Mike Jacobs helped the Marlins to their seventh straight win with that combination, as the Blue Jays go down 8-2. The Marlins are just percentage points behind Atlanta in the NL East, both 13 games out. Carlos Guillen also had the trifecta for Detroit as the Tigers beat the Cubs 9-3. Palonco and Ordonez also picked up three hits in that game. The Tampa Bay Devil Rays kept the Phillies on their losing streak as Rocco Baldelli drove in and scored two with his single, double and homer. The Devil Rays picked up as many extra-base hits (6) as the Phillies total of hits. Scott Kazmir pushed his record to 8-4 with nine strikeouts in five innings. Johnny Damon was the only player with the three way combo today whose team lost. Maybe it's because he picked up that extra single. :-) Special mention to Juan Encarnacion who went three for four, but hit a second home run instead of the single. Juan drove in three of the Cardinals six runs as they defeated the Rockies 6-5. Posted by StatsGuru at 10:07 PM
| Comments (0)
| TrackBack (0)
They're Gonna Score
Permalink The Baseball Crank looks at the best players in terms of scoring once they reach base. He wanted to see how Jose Reyes ranked. He's good, but not top ten. Posted by StatsGuru at 09:45 AM
| Comments (0)
| TrackBack (0)
June 01, 2006
24
Permalink The Diamondbacks finally score. After 24 straight scoreless innings, the Arizona offense puts two runs on the board against in the 8th against Atlanta. They did have some help from the Atlanta defense, but Shawn Green came through with a two-out, two-run single. Like last night, their pitching's been great, as Cruz shutout the Braves through seven innings. Brandon Lyon is on to try to preserve the two run lead. Update: Lyon pitches a scoreless inning. Julio gives up a leadoff home run to Andruw Jones, but that's it as the Diamondbacks take the 2-1 victory. Correction: Fixed the final score. Posted by StatsGuru at 10:09 PM
| Comments (1)
| TrackBack (0)
May 31, 2006
Pirate Power
Permalink The Pittsburgh Pirates continued their roll last night, pounding the Brewers 12-1. They've scored 57 runs in their last six games. Almost everyone is contributing. What's very encouraging is the youngsters are on a roll. Bay, Castillo, Paulino and Sanchez could form a decent core for this team. Jason showed them how it's done, and the rest are following suit. Posted by StatsGuru at 08:52 AM
| Comments (0)
| TrackBack (0)
May 27, 2006
Low Run Games
Permalink The Cubs scored one run today as they lost to Atlanta 2-1. It was the 15th time this season the Cubs were held to one run or less. That's the most in the majors; Kansas City and Seattle are tied for second with 11 each. The Cubs lost all 15 games (no real suprise there). The Tigers have been held to 1 run or less four times and are 2-2 in those games, the only team with a .500 record in the majors. Posted by StatsGuru at 05:36 PM
| Comments (3)
| TrackBack (0)
May 26, 2006
Walking to the Top
Permalink Bobby Abreu won't mind batting leadoff if the Phillies make the request: "Anything that's better for the team. Anything to win games," Abreu said. It's the right move. Rollins at .304 is just making too many out in front of the good hitters. Abreu's slugging percentage is the lowest among the sluggers on the team, making him better in front that behind that group. The Lineup Analysis tool agrees that Abreu should be at the top as well. Posted by StatsGuru at 08:18 AM
| Comments (4)
| TrackBack (0)
May 14, 2006
Heat and Offense
Permalink Daniel Medina sends a link to this article by Alan Schwarz on how the weather was responsible for the offensive surge in April:
This was the warmest April since records started being kept in 1895. Good work here. If you chart offense by month over time, you see the warmest months tend to have the best averages:
This data is from 2000 on, and contains two hot Aprils. I really like the way the article ends:
It usually is. Posted by StatsGuru at 11:07 PM
| Comments (5)
| TrackBack (0)
Five and Five
Permalink Bleed Cubbie Blue, in a very humorous column on the Cubs loss today, asks if there's been a game with one batter with five walks and one with five strikeouts before. The Day by Day Database goes back to 1974, and I only found one instance. It happened on May 23, 1987. The Cubs beat the Braves 7-6 that day in 16 innings. Dale Murphy walked five times for the Braves, and Ozzie Virgil, the Braves catcher, struck out five times. I found no examples in nine inning games. Posted by StatsGuru at 08:14 PM
| Comments (0)
| TrackBack (0)
May 08, 2006
High Variance Home Runs
Permalink Sabernomics looks at the causes of the home run boom of the last decade plus and makes a good case that it's the distribution of talent among pitchers due to expansion that's the likely cause. I love this post, because it confirms something I wrote after the 1993 season. In The STATS Baseball Scoreboard 1994, page 90 there is an article titled What Does Expansion Affect More: Pitching or Hitting? Here's a scan from the book. The scan is Copyright 2006 STATS LLC, reprinted with permission. Posted by StatsGuru at 07:15 PM
| Comments (3)
| TrackBack (0)
May 07, 2006
Disappearing Runs
Permalink The western evening games offered a scarcity of runs last night. The highest scoring game took place in Los Angeles where the Dodgers edged out the Brewers 5-4. Baez blew the save but picked up the win when Lofton doubled in the bottom of the ninth and Garciaparra singeld him home. The Mariners and Indians combined for five runs as Joel Pineiro allowed a leadoff home run to Grady Sizemore, and then nothing for eight innings as Seattle takes a 4-1 victory. Pineiro threw exactly 100 pitches, 69 for strikes as he gave up four hits while striking out six. Cincinnati played at Arizona, and those team managed to score four runs. The Diamondback stay hot and tied for first with Colorado. Bronson Arroyo took his first loss, although he deserved to give up more than three runs. Batters went 11 for 27 against Bronson last night, but he only walked one batter and most of the power came with the bases empty. In fact, 6 of the 11 hits were with no one on. The final score was 3-1 Arizona. The Cubs offense continues to flail. In their last eight games, Chicago has seen four shutouts thrown against them, and hasn't scored more than two runs in a game for a total of six runs. Last night, Sean Marshall pitched brilliantly for six innings, not allowing a hit or run until the sixth. But that run total matched Peavy's for the night, and the San Diego bullpen proved tougher, pitching four scoreless innings before backup catcher Rob Bowen hit the second home run of his career leading off the tenth to win the game 2-1 for San Diego. The Cubs are scoring 2.6 runs per game since they lost Derrek Lee to an injury. Overall, offense in the majors is declining as the season progresses. The following chart shows runs per game by day, with a trend line (linear regression) showing how runs are headed down. Is it injuries to key players? Bad starts by big names? The lack of amphetamines taking it's toll? Just plain better pitching? Coors Field playing like the Astrodome? Bad weather lately? I'd love to hear your ideas. (Click chart for a larger view.)
Posted by StatsGuru at 08:43 AM
| Comments (4)
| TrackBack (0)
April 26, 2006
Pad-Ks
Permalink Through five innings, Orlando Hernandez has whiffed nine Padres. A big difference between San Diego this year and last is their level of strikeouts. In 2005 the Padres batters struck out the fifth fewest times in the NL. Coming into today, they saw strike three the six most in the league. Arizona leads 2-1 in the middle of the sixth. Posted by StatsGuru at 05:16 PM
| Comments (1)
| TrackBack (0)
April 19, 2006
Park Flip
Permalink Matt Holliday singled in the winning run in the 11th inning last night at Coors, giving the Rockies a 3-2 victory over the San Diego Padres. Park Indexes give us a measure of how much different stadiums help or hurt various statistics. It's basically the playing time adjusted ratio of home/road numbers. A score of 100 indicated a neutral park. A score below 100 indicates a park that hurts the stat, above 100 helps. Right now, the Coors run index is 78.1, fourth lowest in the majors, while PETCO sits at 135.1, fourth highest. These two parks are usually at the opposite ends of runs scored, with Coors extremely high and PETCO extremely low. It continues to be a strange offensive year. Posted by StatsGuru at 07:24 AM
| Comments (1)
| TrackBack (0)
April 17, 2006
Cranking the Ball
Permalink Baseball Minutia takes on claims of a juiced ball by looking at how previous changes in the ball affected offense. Hat tip Red Reporter. Posted by StatsGuru at 01:37 PM
| Comments (0)
| TrackBack (0)
April 14, 2006
Offense Still Up
Permalink Comparing the same time period and using the first six years of this century, offense remains high by comparison.
Also, comapre the home run leader board this year vs. 2005. Nineteen players with four or more homers this season vs. seven last year. And the league leader had five. So what's different? One person in the comments this year suggests the umpires are calling a very small strike zone. However, strikeouts are very much in line with previous years, so I'm not sure that's the explanation (I'd expect strikeouts to be down if the strike zone were smaller). Still, it's something to watch. I've never bought the intentional juiced ball theory. It's possible Rawlings changed the manufacturing process, but I really don't think the commissioner makes a call and the balls start flying out of the park. Of course, it might be that steroids helped pitchers more than batters. Sure there were some sluggers who bulked up, but a number of the players caught last year spent their time on the mound. Maybe we've been looking at the whole scandal the wrong way. Instead of the sluggers keeping up with each other, the real abusers were pitchers trying to keep up with hitters. Or maybe it's just Atlanta's pitching staff falling apart. Posted by StatsGuru at 09:24 AM
| Comments (16)
| TrackBack (0)
April 11, 2006
How to Get Out of a Slump
Permalink A photo essay hosted by Batgirl. Posted by StatsGuru at 07:36 AM
| Comments (0)
| TrackBack (0)
April 10, 2006
Successful Thieves
Permalink Are teams finally realizing the value of a stolen base in relation to the caught stealing? The rule of thumb going back to the hidden game of baseball is that teams needed to swipe successfully two-thirds of the time just to break even in terms of runs. The percentage goes up as runs become more plentiful. There's a misconception that sabermetricians don't like the stolen base. What they hate is the caught stealing, and too many teams take an undue risk running. So far in 2006, however, that's not the case. Runners are stealing at a 75% clip (77 steals in 102 attempts). Twenty three of the thirty teams are above the 66.7% break even point. The Reds ran the best, with Freel and Lopez combining to make the team 7-0. The Cardinals ran the most, swiping seven in nine tries. And in an effort to show just how little stolen bases do matter, Detroit scored big while stealing just one base in five attempts. The only team not to attempt a steal was the Pittsburgh Pirates. Maybe a little of DePodesta's logic rubbed off on Tracy after all.
Posted by StatsGuru at 07:33 AM
| Comments (0)
| TrackBack (0)
April 09, 2006
Bizzaro Rockies
Permalink I just love the home/road split for the Colorado Rockies batters right now. I now it won't last, but no offense at Coors, then exploding at PETCO for five home runs in two games is a low probablility event worth noting. Posted by StatsGuru at 07:45 AM
| Comments (0)
| TrackBack (0)
April 07, 2006
All Cylinders
Permalink The Seattle Mariners are off to a 3-1 start, and their offense is carrying the team. They're scoring 6.5 runs per game. They're hitting for a high average, posting a high OBA, and slugging over .500. Part of this is they're not striking out much, just 22 in four games, or 5.5 per game. Lower strikeouts mean more balls in play, more balls in play mean more hits. Note, too, that they appear to be agressive on the bases with 3 triples already. The most triples any team's had in the last 30 years was 79 by the 1979 KC Royals. U.S.S. Mariner discusses that here. Posted by StatsGuru at 09:01 AM
| Comments (3)
| TrackBack (0)
March 23, 2006
The Fusion of Fuson
Permalink Ducksnorts offers an insightful commentary on the methods of Grady Fuson in teaching hitters to be "patiently aggressive." Baseball Musings is conducting a pledge drive in March. Click here for details. Posted by StatsGuru at 02:55 PM
| Comments (0)
| TrackBack (0)
March 21, 2006
Kicking in Early
Permalink Eric Chavez has a "Why didn't I think of that!" moment, thanks to new hitting coach Gerald Perry: Now, Perry is focused solely on hitting, and the A's hitters are having a good spring. Third baseman Eric Chavez and second baseman Mark Ellis are especially locked in, with Chavez hitting .379 with five homers and Ellis .381 with four homers. Baseball Musings is holding a pledge drive during March. Click here for details. Posted by StatsGuru at 03:46 PM
| Comments (10)
| TrackBack (0)
March 09, 2006
Pirates and Plate Discipline
Permalink Jeff Basset donated $50 and sends the following dedication: To Jessica, Caitlin, Rachael, Marissa, Molly, Glynis and The Redoubtable Kirbydog. Dodger Thoughts notes that Jim Tracy is preaching plate discipline in Pittsburgh. I doubt it will work. Lloyd McClendon did the same thing last year. It seems you can preach this all you want, but it's very difficult to change a player. Sammy Sosa did it, but there aren't many others. Baseball Musings is conducting a pledge drive in March. Click here for details. Posted by StatsGuru at 05:52 PM
| Comments (0)
| TrackBack (0)
February 06, 2006
Run for the Slugger
Permalink Balls, Sticks and Stuff looks at the affect Abreu stealing had on Jim Thome: For example, from 2003 to 2005, Jim Thome had an OPS of .929, but in the 93 instances when Abreu was on second with first base open, Thome had an OPS of .954. Burrell benefited even more, his OPS increasing from .810 to 1.008 and his batting average from .249 to .291 in 104 instances. Walking a slugger with first base open isn't a bad thing. It increases the run potential for the inning, and extends the offense for future innings (the top of the lineup is more likely to bat again). In the Phillies case, with two sluggers coming up next, it's tough to pitch around both. Posted by StatsGuru at 09:03 AM
| Comments (3)
| TrackBack (0)
January 18, 2006
Charting Pitches
Permalink David Appleman at The Hardball Times puts Baseball Info Solutions pitch charting to good use. He creates graphs telling us where balls are put into play for hits, and compares Albert Pujols' plate coverage to Corey Patterson. Let's hope he publishes these for every MLB player. Update: It's interesting to note that batters have better luck on pitches above the strikezone than with pitches to the left or the right. That makes me think that the old strike zone was indeed the correct strike zone, and batters shouldn't complain about the high strike. It's a hittable pitch. Posted by StatsGuru at 04:52 PM
| Comments (1)
| TrackBack (0)
January 16, 2006
Batting Luck
Permalink Jeff at Brew Crew Ball looks at the luckiest hitters by batting average on balls in play and finds that luck does not hold up from year to year. Posted by StatsGuru at 04:32 PM
| Comments (2)
| TrackBack (0)
January 08, 2006
Who Gets the Grounders
Permalink I've wondered for a while if pitchers or hitters had more of an effect on balls in play being in the air or on the ground. What if pitchers were the only cause of the ball being lifted in the air or not? Then, we wouldn't expect the probabilities to change no matter what type of batter he was facing. If the batter was responsible, then changing the type of pitcher wouldn't matter. To study this, I selected a group of pitchers that gathered 400 IP from 2002-2004. There were 101 pitchers in the group, and I divided them into quartiles on the probability of a ground ball. Quartile 1 is the group with the lowest probability of a ground ball, quartile 4 the highest. I also selected batters with 1000 plate appearances in that time frame. There were 243 batters in the study, also divided into quartiles on the same statistic. Here's a table representing the probabilities of the four quartiles.
Next, I pitted each pitcher quartile vs. each batter quartile:
As you can see, the type of pitcher and the type of batter both matter. So if you really need a ground ball, get your best ground ball pitcher in against a ground ball hitter. Posted by StatsGuru at 08:56 PM
| Comments (10)
| TrackBack (0)
December 28, 2005
Leading Off
Permalink I was doing some research for my radio show tonight, and I wanted to see just how good Damon was as a leadoff man. Here's a table of OBA batting in the #1 slot over the last three seasons, minimum of 500 plate appearances:
What's clear is that Jeter is a much better leadoff hitter than Damon, and I'd bat them Jeter-Damon rather than the other way around. However, from what I can tell, Damon prefers to bat leadoff and Jeter second, so it's likely they'll be happier with the proposed arrangement. It's continues to shock me that there are no great leadoff men anymore. There should be two or three players capable of generating a .400 OBA from the leadoff slot. No wonder Rickey Henderson believes he can still play in the majors. The best leadoff man in terms of getting on base is a catcher! Posted by StatsGuru at 03:14 PM
| Comments (15)
| TrackBack (0)
December 12, 2005
Seeing Better
Permalink SawxBlog links to a scientific study of the effect of Laser Refractive Surgery on offense. Bottom line, it doesn't help has much as you might think. Posted by StatsGuru at 12:30 PM
| Comments (2)
| TrackBack (0)
September 20, 2005
Leaving Men On
Permalink Alex Belth at Bronx Banter shows that Yankees fans are correct, the Yankees are leaving a lot of runners on base. One of his commenter's presents a chart that shows the Yankees are rather inefficient in bringing runners home. In general, I'm not a big fan of the left on base number. You need to couple it with total runs scored to get a good feel for what it means. If you're not scoring a lot of runs but leaving tons of ducks on the pond, then you have an offensive problem. However, it's a good problem, since the team likely has a high OBA, and eventually those runners will come around to score. This is what happened in Boston last season. The sports talk hosts were complaining about all the runners left on, then in the second half of the season they started coming around to score. I'd much rather have that situation than few runners on/few left on base. In that case, you don't have much potential to score runs. If, like the Yankees, you are a high scoring team, leaving lots of men on base really isn't a problem. Just as it doesn't matter how you get on base, it doesn't matter how you score your runs. It's nice to be efficient, but leaving two on to score one is fine as long as you do it often enough. The Yankees problem this year isn't leaving lots of men on base; it's needing to score a lot of runs to win games due to the pitching and defense. Posted by StatsGuru at 04:06 PM
| Comments (2)
| TrackBack (0)
September 19, 2005
Lead Off Low
Permalink The Baseball Crank explores an issue that's been bothering me for a while, where are the good lead off men? It seems the players with great OBAs today are also sluggers, making it difficult to find a player who fits the high OBA/low power profile of the table setter. That's still no excuse for batting someone with an OBA below .320 in the #2 slot. Posted by StatsGuru at 10:38 AM
| Comments (2)
| TrackBack (0)
September 18, 2005
Top Fish
Permalink Castillo and Conine continue to do a good job at the top of the Marlins order. The pair is four for five with 3 walks tonight, scoring three runs and driving in two. With this lineup, the first four batters in the lineup all have OBA's over .370. They're not only setting up the bottom of the order, they're giving each other more plate appearances. Posted by StatsGuru at 10:22 PM
| Comments (0)
| TrackBack (0)
September 07, 2005
Offense Down
Permalink Bryan Johnson writes:
I noticed a couple of weeks ago that no one had a long hit streak. I used to print out that report every day as part of my stat package for ESPN, and I found that the number of long streaks was in proportion to the amount of offense in the league. But when I looked at runs scored compared to last year, they were still very close.
However, offense is down over the last couple of months and really down in September:
| |||||||||||||||||||||||||||||||||||||||||||||||||||||||||||||||||||||||||||||||||||||||||||||||||||||||||||||||||||||||||||||||||||||||||||||||||||||||||||||||||||||||||||||||||||||||||||||||||||||||||||||||||||||||||||||||||||||||||||||||||||||||||||||||||||||||||||||||||||||||||||||||||||||||||||||||||||||||||||||||||||||||||||||||||||||||||||||||||||||||||||||||||||||||||||||||||||||||||||||||||||||||||||||||||||||||||||||||||||||||||||||||||||||||||||||||||||||||||||||||||||||||||||||||||||||||||||||||||||||||||||||||||||||||||||||||||||||||||||||||||||||||||||||||||||||||||||||||||||||||||||||||||||||||||||||||||||||||||||||||||||||||||||||||||||||||||||||||||||||||||||||||||||||||

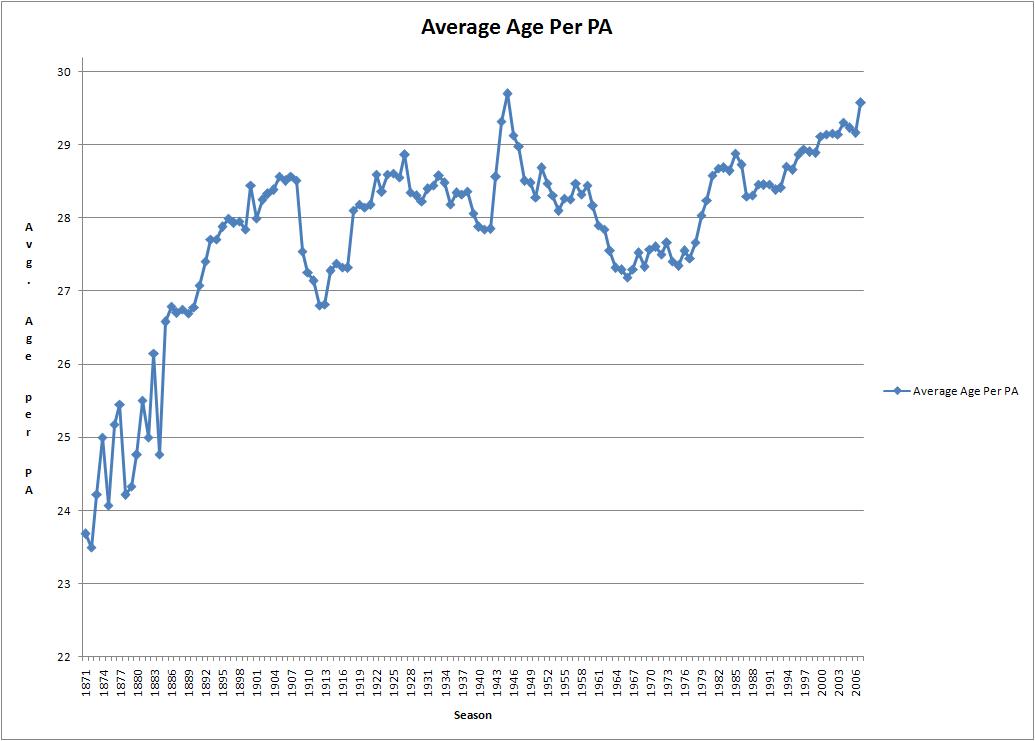
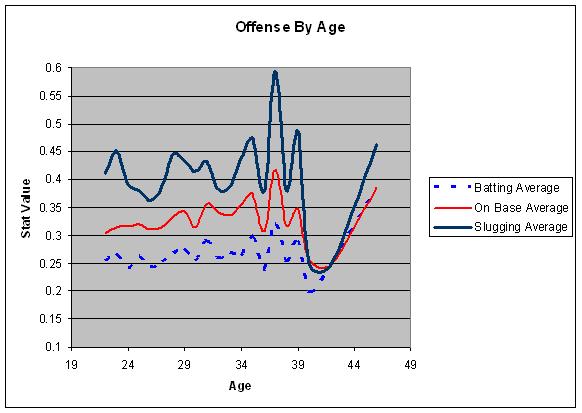


