April 15, 2005
Offense and Age
Age does not seem to be the problem with the fall off in offense as this graph shows. (Click on graph for a larger image.)
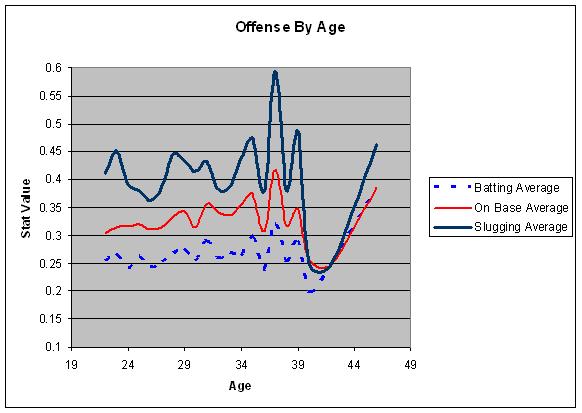
BA and OBA trend up until the mid-30's and are still good after that. They batters who stick around that long are the good ones. We'll see if this trend holds up as the year goes on.
Update: To clarify, this is a graph for this year only. Age is the seasonal age of players, that is, the age before July 1, 2005.
Posted by David Pinto at
05:00 PM
|
Offense
|
TrackBack (0)
Did I miss how this was calculated? Average over x years? If you take bonds out does the late thirties spikes go away? Who is responsible for the 44 plus increase, presumably the right side of the curve has much smaller sample sizes than the left?
Or is this all thus far this year?
Maybe include a link to wherever you describe the data collection averaging etc for those of us who forget easily or read carefully only ocasionally.


