Please help support the Day by Day Database with a donation during the Baseball Musings Pledge Drive.
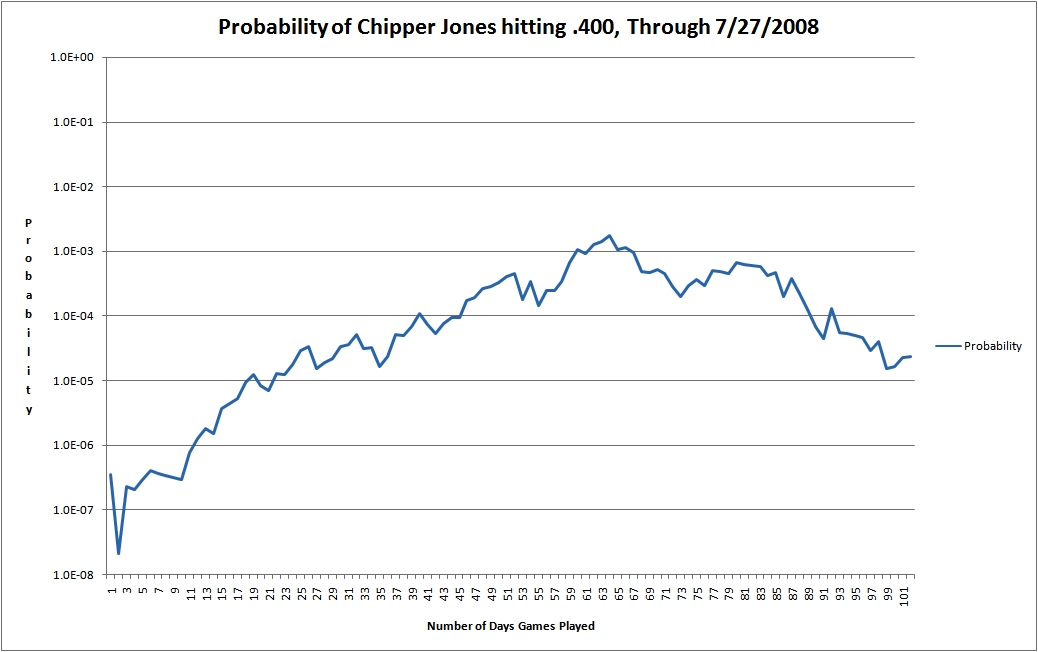
Chipper Jones Probability of Hitting .400 Graph
Here's a graph of Chipper Jones's probability of hitting .400 after each day the Braves play. The X axis show day number, of if the Braves play a double header, both games are rolled into that day. For example, 50 isn't the 50th day of the season, it's the 50th day the Braves played. Putting the dates didn't fit well, and my software left gaps when Atlanta had a off day.
The graph is a logarithmic plot. Each step up represents a ten-fold increase in the probability. I'll try to update the graph every day.
Added 6/8/2008. People have asked for other charts for famous runs at .400. First, George Brett:
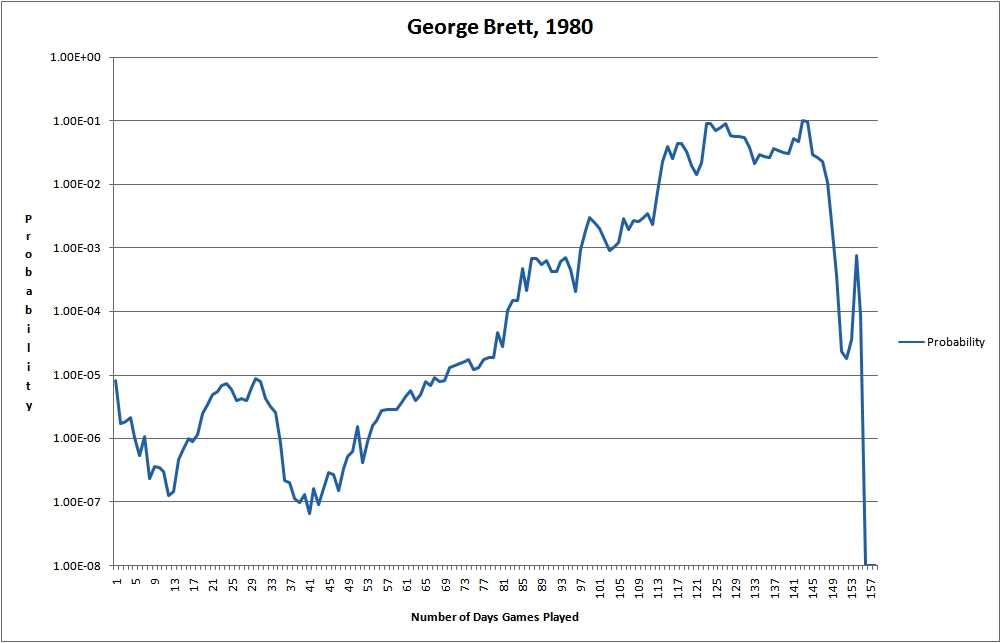
I used Brett's career average going into 1980 for the probability of his getting a hit, .310. George started slowly, then went on a long hot streak from 6/26 to 9/19. In that time he went from a .274 BA to a .3995 BA. George first cracked .400 on 8/17, and was last over .400 on after the game of 9/4. He went a combined 1 for 8 on 9/20 and 9/21 and never recovered.
Rod Carew threatened the mark in 1977. Rod came into 1977 with a .335 career batting average:
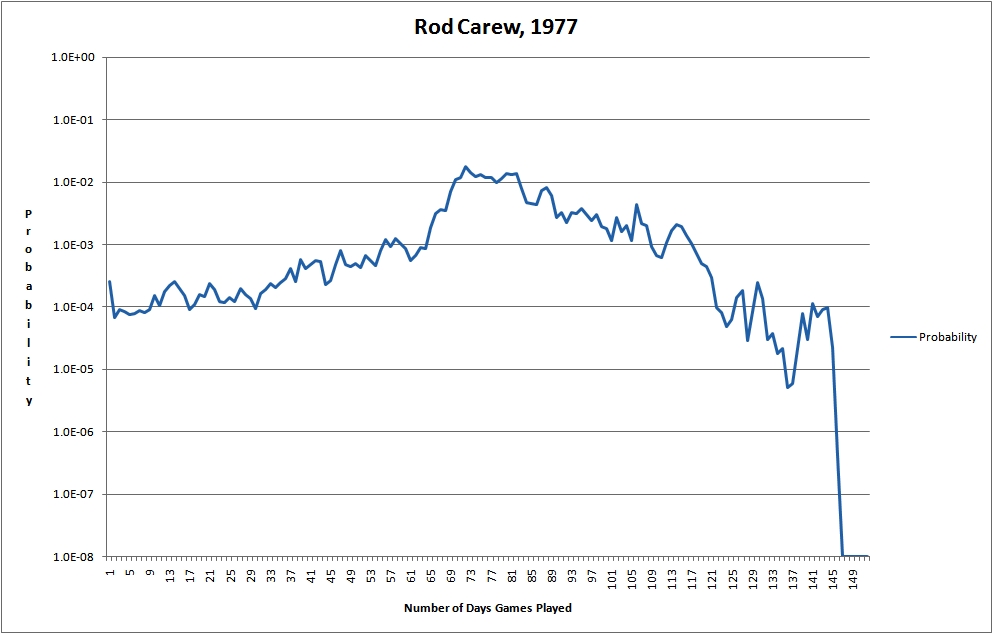
Note Rod never got too high and never got too low until the very end. There are two reasons for this. Rod didn't draw many walks, so his projected at bats were high. He would up with 616. Secondly, he hit well all year, but didn't spend that much time above .400. He went over .400 on 626, reached a high of .408 on 7/2, then fell below .400 on 7/11, never to really come close again. He dropped as low as .374, but finished well to come in at .388 for the season.
Then there's Ted Williams run of 1941. The Splendid Splinter entered 1941 with a .336 career batting average:
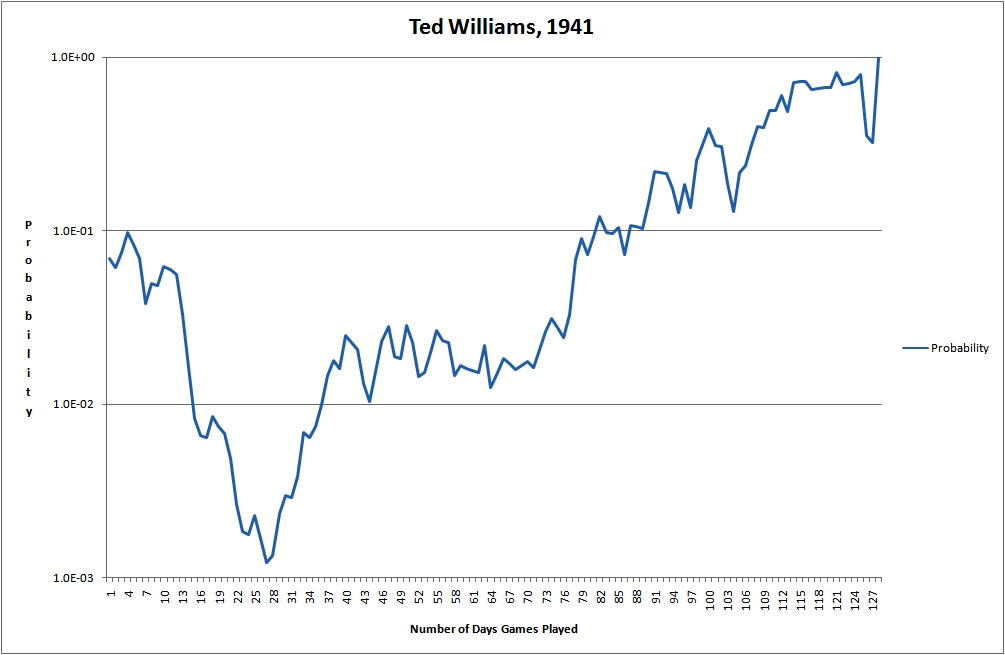
Ted's probability never fell below 1 in 1000. The reason was his start. I don't know if he was injured at the start of 1941, but in the Red Sox first twelve games, Williams had only thirteen at bats. At that point, he was hitting .461 and projecting to very few at bats on the season. He started playing regularly after that, his BA dropping to .308 on 5/2, but back over .400 on 5/25. It stayed over .400 except for a brief period in July and the penultimate day of the season. Technically, he was at .400 going into the final double header, hitting .399554. Keeping his BA above .400 so long kept the probability high.
Day by Day Database